Fig. 10
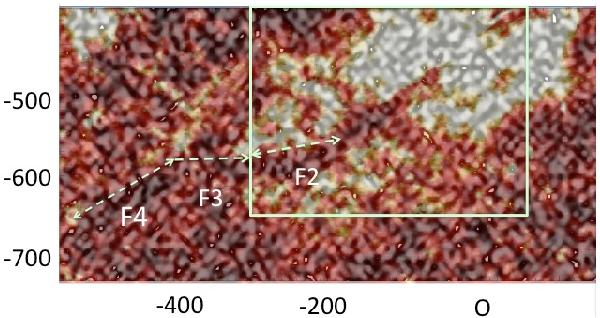
Divergence (white small areas) and convergence (dark line areas) map overlaid on a transparent SDO/304 Å image in a large field of view in solar coordinates. The bright large regions correspond to the plage regions. We notice dark lines in the edges of the filament channel, mainly on the northern edge, corresponding to areas of convergence close to the footpoints of the different sections of the filament (see the dashed lines corresponding to F2, F3, F4 filament sections). The short dashed lines in F3 correspond to convergence areas in the network (around − 400, − 600) from which the eruption may have started (Fig. 4).
Current usage metrics show cumulative count of Article Views (full-text article views including HTML views, PDF and ePub downloads, according to the available data) and Abstracts Views on Vision4Press platform.
Data correspond to usage on the plateform after 2015. The current usage metrics is available 48-96 hours after online publication and is updated daily on week days.
Initial download of the metrics may take a while.