Fig. 1
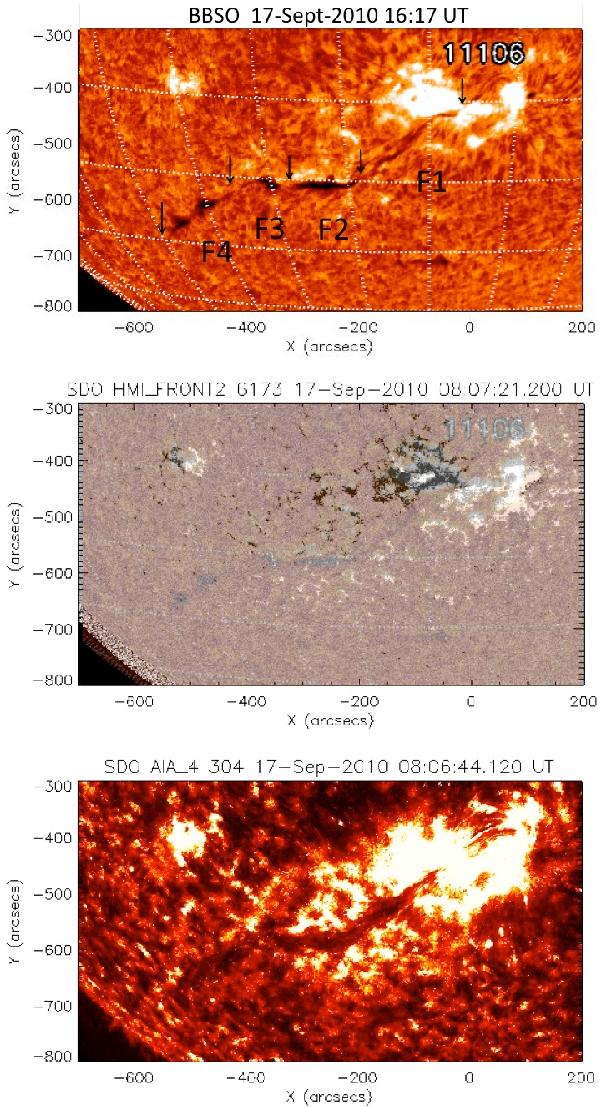
Active region NOAA 11106 with a long Hα filament on September 17, 2010 (BBSO at 16:17 UT) (top panel). The arrows indicate the limit of the different sections of the filament (F1, F2, F3, F4). HMI longitudinal magnetic field at 09:00 UT saturated at +/−100 G (middle panel), Active region and filament channel in 304 Å (AIA) at 08:06 UT (bottom).
Current usage metrics show cumulative count of Article Views (full-text article views including HTML views, PDF and ePub downloads, according to the available data) and Abstracts Views on Vision4Press platform.
Data correspond to usage on the plateform after 2015. The current usage metrics is available 48-96 hours after online publication and is updated daily on week days.
Initial download of the metrics may take a while.