Fig. 1
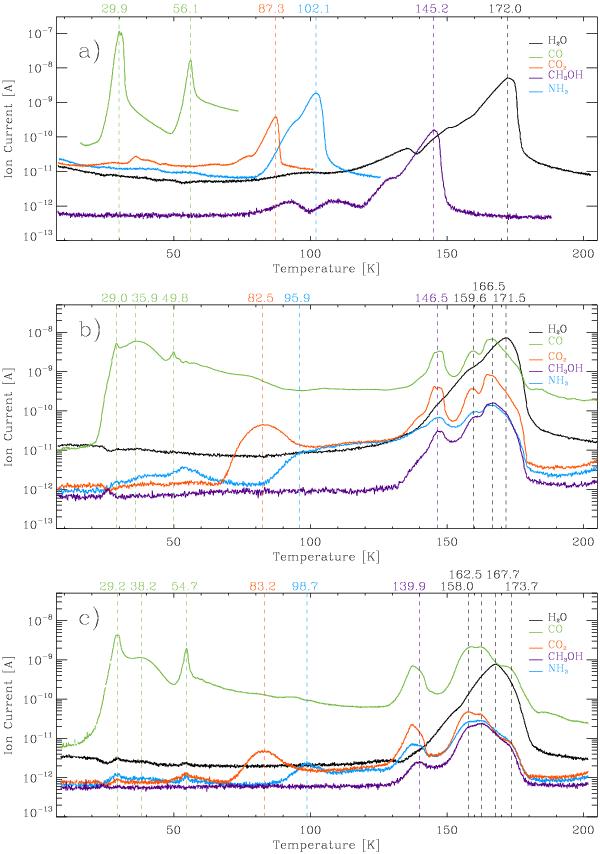
TPD curves of each component in experiments a) E1-E5 (pure ices); b) E10 (pre-cometary ice mixture with heating rate = 2 K/min). Desorption of a molecule with mass fragment m/z = 15 at T < 60 K does not correspond to NH3, since that feature is not shared with the m/z = 17 fragment (not shown for clarity), and it may be due to a contaminant; c) E11 (pre-cometary ice mixture with heating rate = 1 K/min). Temperatures of desorption peaks are indicated. Ion current in the y-axis corresponds approximately to the partial pressure (mbar) in the main chamber. Note that the y-axis is on a logarithmic scale.
Current usage metrics show cumulative count of Article Views (full-text article views including HTML views, PDF and ePub downloads, according to the available data) and Abstracts Views on Vision4Press platform.
Data correspond to usage on the plateform after 2015. The current usage metrics is available 48-96 hours after online publication and is updated daily on week days.
Initial download of the metrics may take a while.