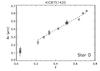
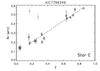
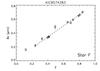
Fig. 7
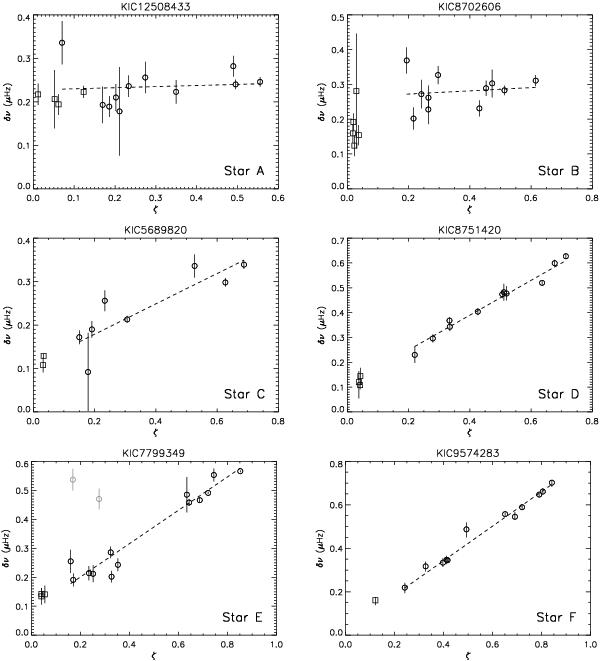
Observed splittings (open symbols) for modes of degrees l = 1 (circles) and l = 2 (squares), plotted as a function of the parameter ζ, which indicates the trapping of the modes (a value of ζ closer to 0 indicates a p-dominated mode, whereas a value of ζ closer to 1 indicates a g-dominated mode). The dashed lines indicate linear regressions of the relation between the splittings of l = 1 modes and the parameter ζ. Gray symbols indicate suspicious measurements that were not taken into account (see text).
Current usage metrics show cumulative count of Article Views (full-text article views including HTML views, PDF and ePub downloads, according to the available data) and Abstracts Views on Vision4Press platform.
Data correspond to usage on the plateform after 2015. The current usage metrics is available 48-96 hours after online publication and is updated daily on week days.
Initial download of the metrics may take a while.