Fig. 3
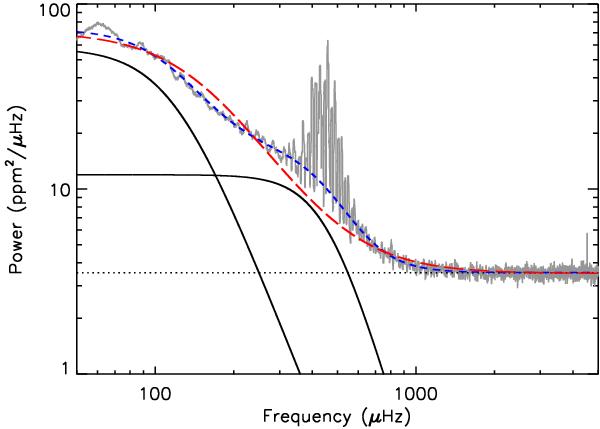
Power spectrum of KIC 9574283 (smoothed over a 10 μHz boxcar) computed with 650 days of Kepler data (gray curve). Two Harvey-type laws (solid black lines) had to be considered to reproduce the shape of the background. The fitted background is represented by the dashed blue line, while the long-dashed red line shows the background that is obtained with only one Harvey profile. The dotted line shows the contribution from the photon noise.
Current usage metrics show cumulative count of Article Views (full-text article views including HTML views, PDF and ePub downloads, according to the available data) and Abstracts Views on Vision4Press platform.
Data correspond to usage on the plateform after 2015. The current usage metrics is available 48-96 hours after online publication and is updated daily on week days.
Initial download of the metrics may take a while.