Free Access
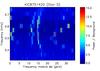
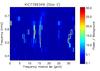
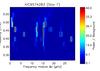
Fig. 2
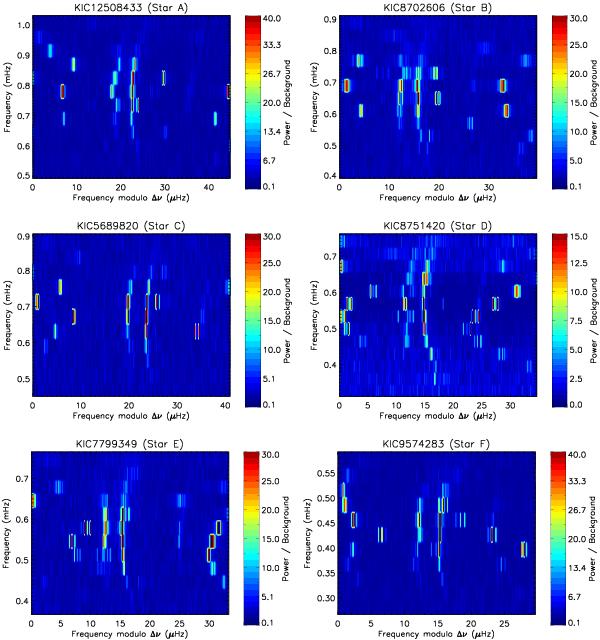
Échelle diagrams of the stars from our sample. The mean large separations that were used to build the diagrams are specified in Table 1. For more clarity, the power spectra were binned over a 0.25 μHz boxcar and clipped at a maximum of 20 to 40 times the noise level.
This figure is made of several images, please see below:
Current usage metrics show cumulative count of Article Views (full-text article views including HTML views, PDF and ePub downloads, according to the available data) and Abstracts Views on Vision4Press platform.
Data correspond to usage on the plateform after 2015. The current usage metrics is available 48-96 hours after online publication and is updated daily on week days.
Initial download of the metrics may take a while.