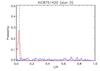
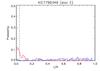
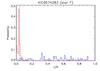
Fig. C.1
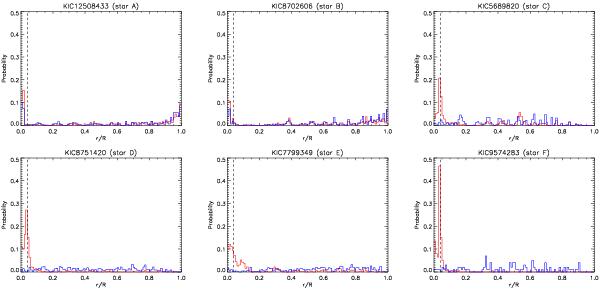
Distribution of the depth rmin at which a discontinuity in Ω(r) is found to be most probable for simulations considering either a smooth input rotation profile (blue histogram) or discontinuous one at a depth  (red histogram). The location of the true discontinuity for the latter case is indicated by the vertical dashed line.
Current usage metrics show cumulative count of Article Views (full-text article views including HTML views, PDF and ePub downloads, according to the available data) and Abstracts Views on Vision4Press platform.
Data correspond to usage on the plateform after 2015. The current usage metrics is available 48-96 hours after online publication and is updated daily on week days.
Initial download of the metrics may take a while.