Free Access
Fig. 15
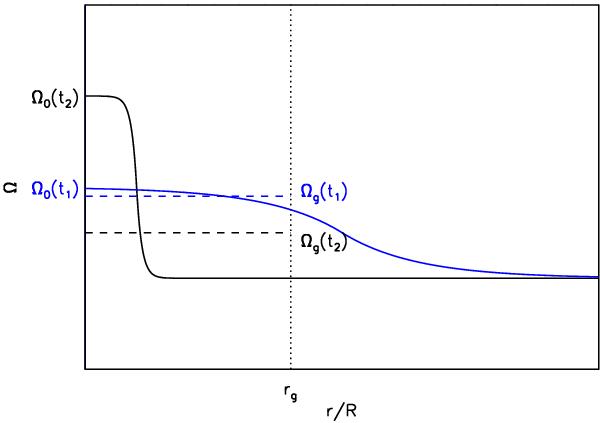
Schematic rotation profiles for a star in which a rotation gradient is building up in the g-mode cavity (delimited by the vertical dotted line) between times t1 (black curves) and t2 (blue curves). The dashed lines indicate the mean rotation rate in the g-mode cavity Ωg and the rotation rate in the center is denote Ω0.
Current usage metrics show cumulative count of Article Views (full-text article views including HTML views, PDF and ePub downloads, according to the available data) and Abstracts Views on Vision4Press platform.
Data correspond to usage on the plateform after 2015. The current usage metrics is available 48-96 hours after online publication and is updated daily on week days.
Initial download of the metrics may take a while.