Fig. 13
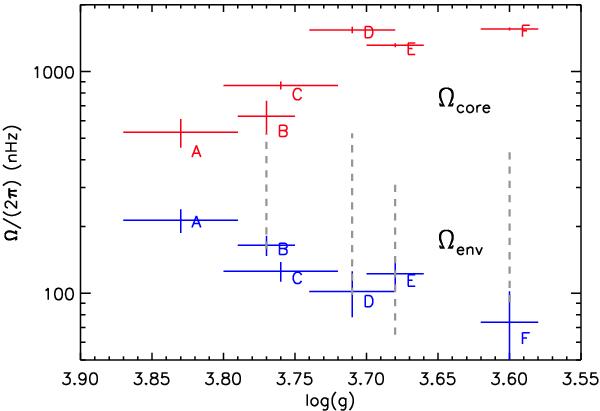
Core (red symbols) and envelope (blue symbols) rotation rates obtained with the OLA method (see Sects. 6.2.1 and 6.2.2) plotted as a function of the surface gravity. The letter corresponding to each star is specified. The dashed gray lines correspond to the range of surface rotation rates predicted by van Saders & Pinsonneault (2013) for the stars that lie in the range of parameters that they considered. The horizontal and vertical lines indicate 1σ error-bars.
Current usage metrics show cumulative count of Article Views (full-text article views including HTML views, PDF and ePub downloads, according to the available data) and Abstracts Views on Vision4Press platform.
Data correspond to usage on the plateform after 2015. The current usage metrics is available 48-96 hours after online publication and is updated daily on week days.
Initial download of the metrics may take a while.