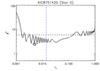
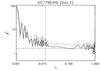
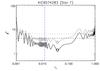
Fig. 12
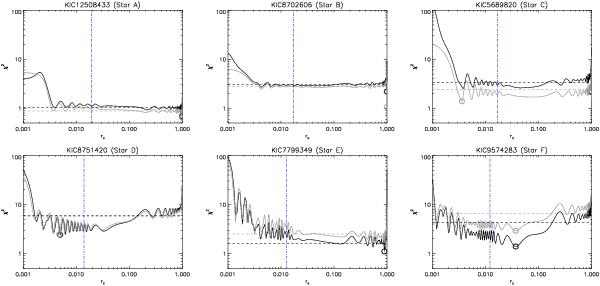
Variations in the reduced χ2 as a function of the radius rc of the assumed discontinuity. The black curves correspond to the inversions performed with the best-fit models of Cesam2k and the gray curves, to the inversions performed with the best-fit models of astec. The circles indicate the lowest value of the χ2 function. The vertical dot-dashed blue line indicates the location of the H-burning shell for the best-fit models.
Current usage metrics show cumulative count of Article Views (full-text article views including HTML views, PDF and ePub downloads, according to the available data) and Abstracts Views on Vision4Press platform.
Data correspond to usage on the plateform after 2015. The current usage metrics is available 48-96 hours after online publication and is updated daily on week days.
Initial download of the metrics may take a while.