Fig. 4
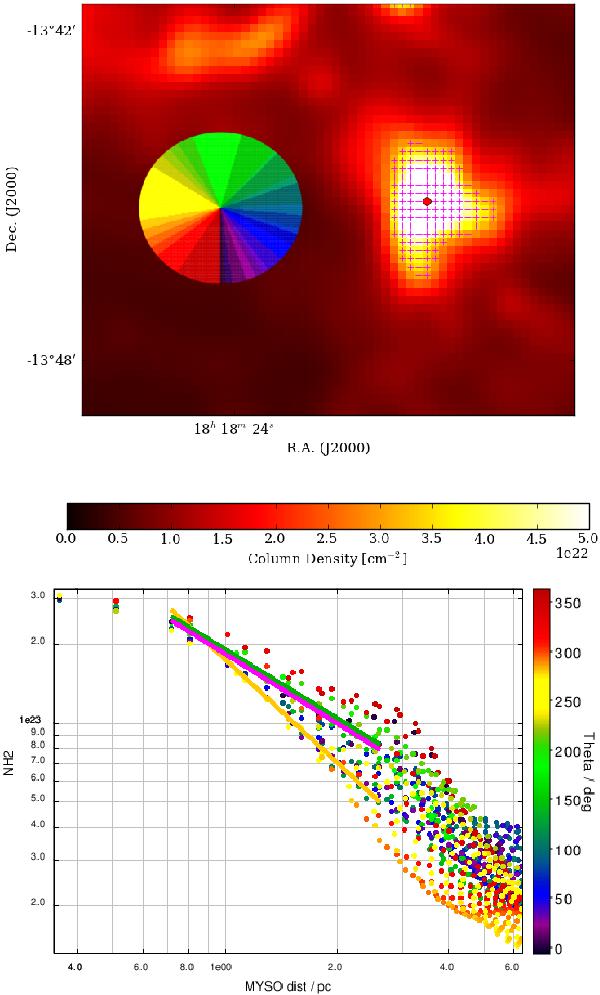
Top: zoom of the column density map on the western condensation. The magenta crosses indicate the pixels contributing to the power law of the PDF. The red dot is the position of the peak of the column density. The colormap is the color code used to show the orientation of the different profiles (e.g. green is north, yellow is east ...). Bottom: radial profiles of the column density of the western condensation. The color indicates the orientation of the profile. The power-law fits are performed around three different directions: north (180◦) in green, east (270◦) in yellow and south (360◦) in purple. Each fit includes all the points in ±40◦ around the main direction.
Current usage metrics show cumulative count of Article Views (full-text article views including HTML views, PDF and ePub downloads, according to the available data) and Abstracts Views on Vision4Press platform.
Data correspond to usage on the plateform after 2015. The current usage metrics is available 48-96 hours after online publication and is updated daily on week days.
Initial download of the metrics may take a while.