Fig. 10
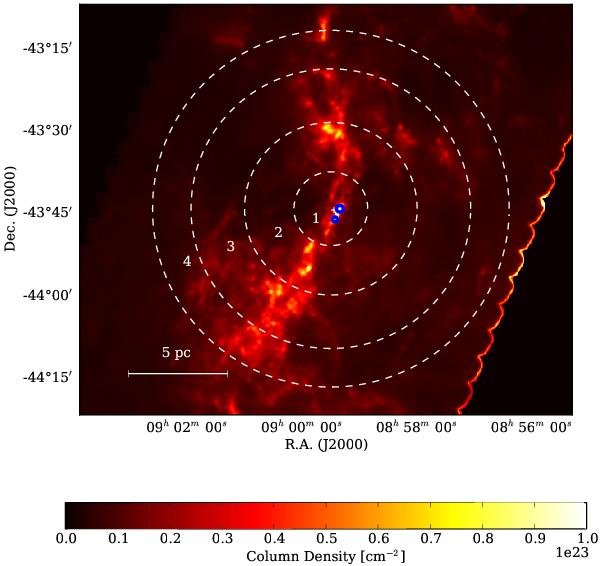
RCW 36 Herschel column density map (Minier et al. 2013). The circles indicate the different regions used for the PDFs. The white cross indicates the position of the main ionizing source. The limit of the Hα emission and the limit of the H ii region are inside region 1. The blue circles indicate the positions of the condensations identified in the PDF of region 1.
Current usage metrics show cumulative count of Article Views (full-text article views including HTML views, PDF and ePub downloads, according to the available data) and Abstracts Views on Vision4Press platform.
Data correspond to usage on the plateform after 2015. The current usage metrics is available 48-96 hours after online publication and is updated daily on week days.
Initial download of the metrics may take a while.