Fig. 7
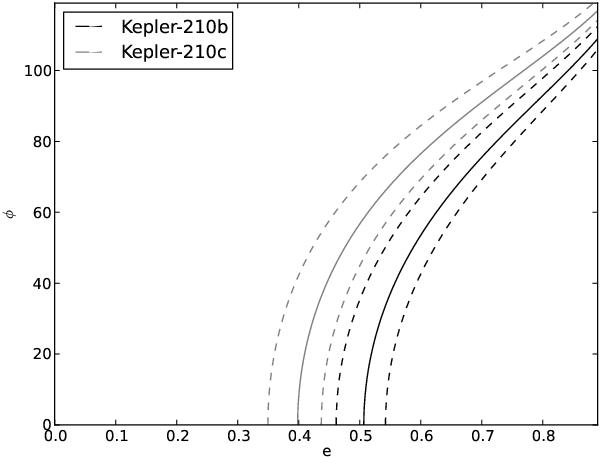
Contour plot of eccentricity versus true anomaly during the mid-transit (φ). For a circular system (e = 0) the density should equal ϱo ⋍ 2.6 g/cm3, as can be calculated for the given values of R⋆ and M⋆. The TBD derived from the a/R⋆ values of ϱ⋆ for the planets Kepler-210b (black line) and Kepler-210c (gray line) can be explained for eccentricities ≳0.4 and ≳0.51 respectively, depending on the true anomaly of the planet during the mid-transit. The dashed lines represent the uncertainty limits.
Current usage metrics show cumulative count of Article Views (full-text article views including HTML views, PDF and ePub downloads, according to the available data) and Abstracts Views on Vision4Press platform.
Data correspond to usage on the plateform after 2015. The current usage metrics is available 48-96 hours after online publication and is updated daily on week days.
Initial download of the metrics may take a while.