Fig. 9
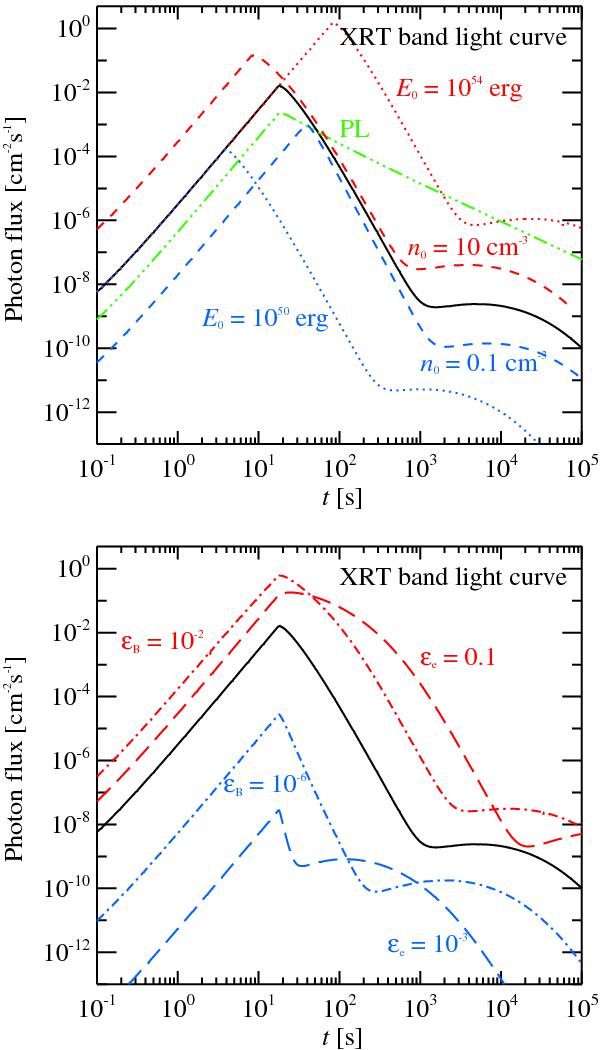
Observer frame light curves in the Swift/XRT band (0.3−10 keV) resulting from different parameter sets. The black solid line in both panels shows the fiducial light curve resulting from Maxwellian electron injection obtained with the same parameters as the spectra in Fig. 8. The green dash-dot-dot-dot line in the top panel represents the emission due to a power-law electron injection function. The other curves represent simulations with a Maxwellian injection term where one parameter at a time is varied from the fiducial value. In the top panel, the dotted (dashed) lines show the light curves when the blast energy E0 (external density n0) is increased/decreased by a factor of 100 (10). In the bottom panel, the long-dashed (dash-dot) lines correspond to the emission when the electron energy fraction ϵe (magnetic energy fraction ϵB) is increased/decreased by a factor of 10 (100).
Current usage metrics show cumulative count of Article Views (full-text article views including HTML views, PDF and ePub downloads, according to the available data) and Abstracts Views on Vision4Press platform.
Data correspond to usage on the plateform after 2015. The current usage metrics is available 48-96 hours after online publication and is updated daily on week days.
Initial download of the metrics may take a while.