Fig. 7
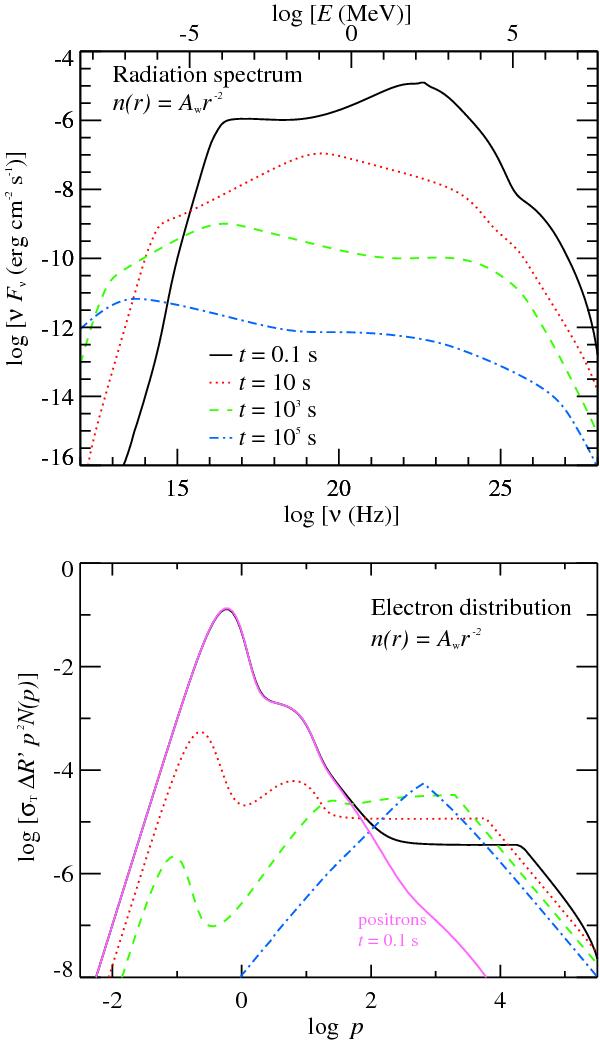
Time evolution of the observer frame photon spectrum (top panel) and electron distribution (bottom panel) in a wind medium when all the relevant radiative processes (synchrotron, Compton and pair production) are accounted for in the simulation. The positron distribution at t = 0.1 s is also shown as a solid magenta line in the bottom panel. The simulation parameters are the same as in Fig. 5.
Current usage metrics show cumulative count of Article Views (full-text article views including HTML views, PDF and ePub downloads, according to the available data) and Abstracts Views on Vision4Press platform.
Data correspond to usage on the plateform after 2015. The current usage metrics is available 48-96 hours after online publication and is updated daily on week days.
Initial download of the metrics may take a while.