Fig. 6
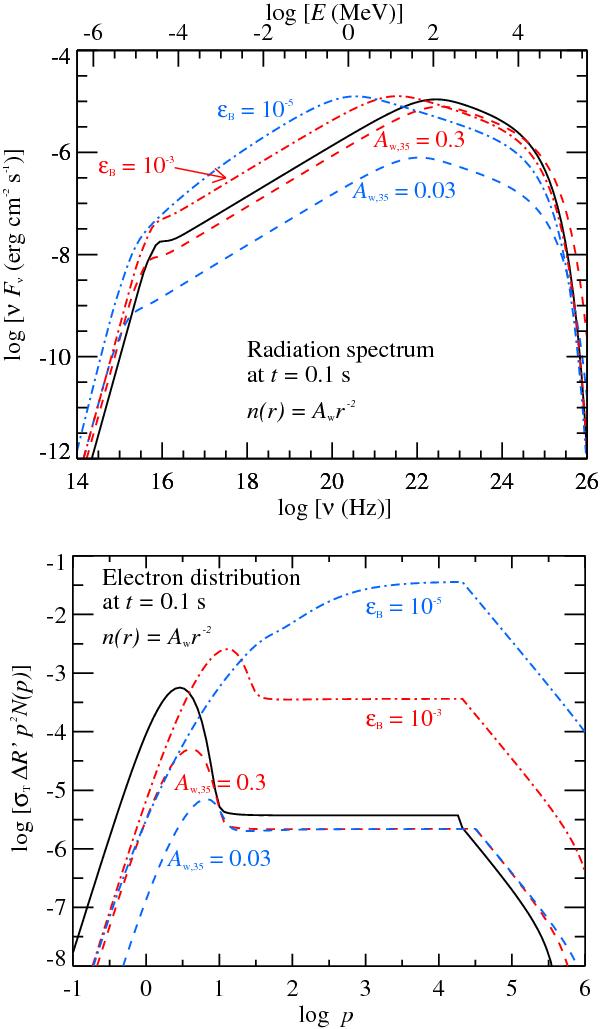
Comparison of the radiation spectrum (top panel) and electron distribution (bottom panel) at t = 0.1 s from Fig. 5 (black solid line) to four cases where the value of one parameter is changed at a time. In two simulations, the wind density is decreased by a factor of 10 (red dashed line) and 100 (blue dashed line) from the fiducial value. In the other two cases, the magnetic energy fraction is decreased by a factor of 102 (red dash-dot line) and 104 (blue dash-dot line).
Current usage metrics show cumulative count of Article Views (full-text article views including HTML views, PDF and ePub downloads, according to the available data) and Abstracts Views on Vision4Press platform.
Data correspond to usage on the plateform after 2015. The current usage metrics is available 48-96 hours after online publication and is updated daily on week days.
Initial download of the metrics may take a while.