Fig. 4
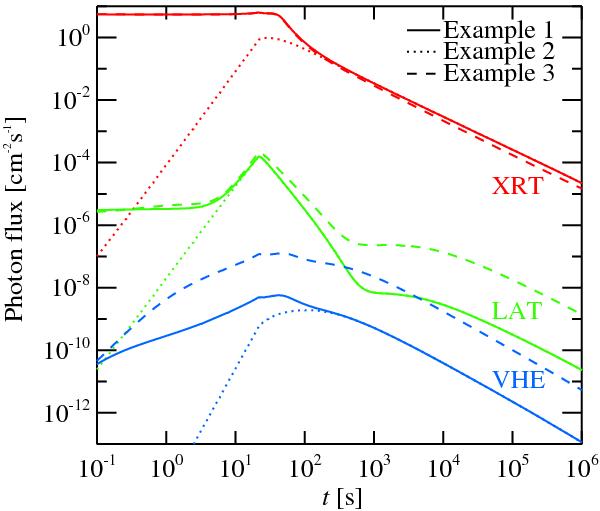
Observer frame light curves in the Swift/XRT band (0.3−10 keV, red curves at the top of the figure), the Fermi/LAT band (0.1−300 GeV, green curves in the middle), and a very high energy (VHE) 0.1−100 TeV band (blue curves at the bottom). The light curves correspond to the simulations presented in Figs. 2 and 3.
Current usage metrics show cumulative count of Article Views (full-text article views including HTML views, PDF and ePub downloads, according to the available data) and Abstracts Views on Vision4Press platform.
Data correspond to usage on the plateform after 2015. The current usage metrics is available 48-96 hours after online publication and is updated daily on week days.
Initial download of the metrics may take a while.