Fig. 7
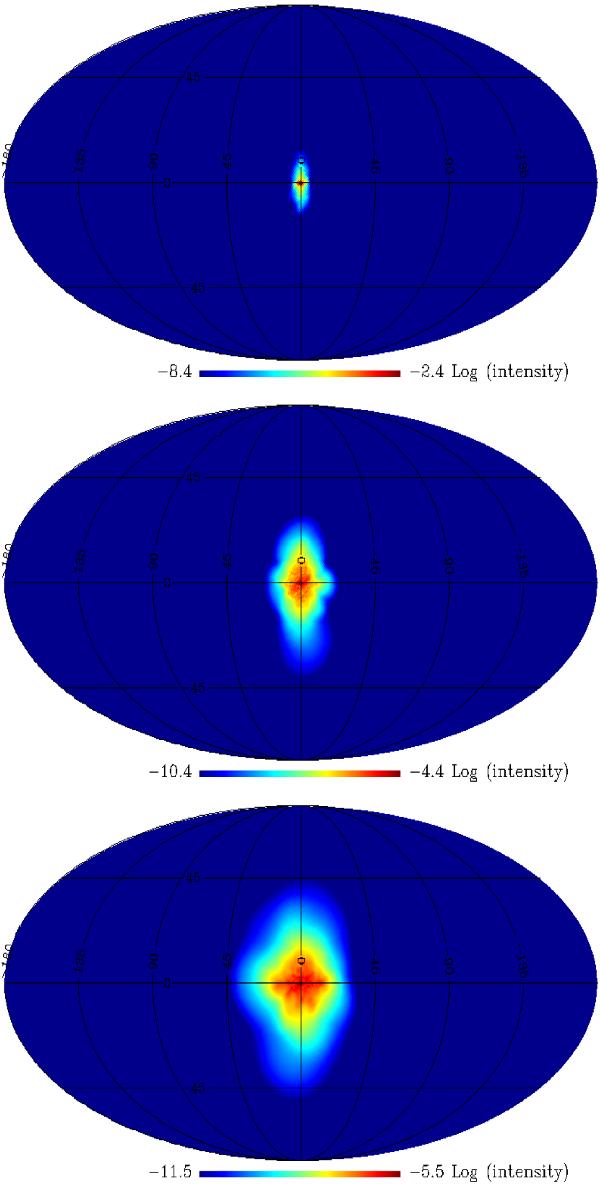
Simulated all-sky maps of the 511 keV intensity distribution for an outburst of 26Al positrons in the CMZ for the X-shape halo field configuration (in ph cm-2 s-1 sr-1). From top to bottom, the maps correspond to the average 511 keV emission between 0 and 1 × 10⁵ yr, 5 × 10⁵ and 6 × 10⁵ yr, 1.9 × 10⁶ and 2 × 10⁶ yr after the outburst, respectively. The number of positrons injected into the outburst is 1058.
Current usage metrics show cumulative count of Article Views (full-text article views including HTML views, PDF and ePub downloads, according to the available data) and Abstracts Views on Vision4Press platform.
Data correspond to usage on the plateform after 2015. The current usage metrics is available 48-96 hours after online publication and is updated daily on week days.
Initial download of the metrics may take a while.