Fig. 4
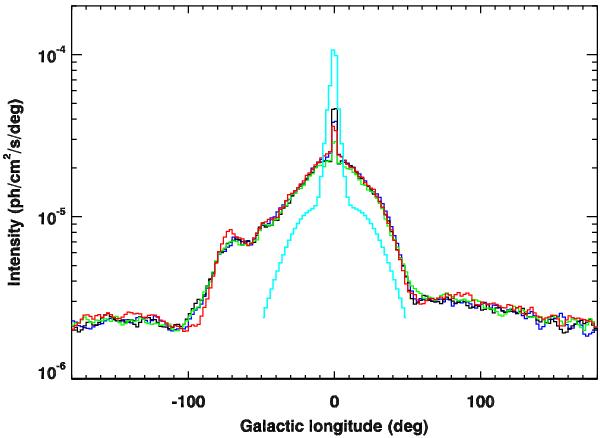
Longitude profiles of the 511 keV emission of all nucleosynthesis positrons, with an SN Ia escape fraction of 5% for 56Ni positrons and for the three halo GMF configurations (corresponding to the maps in Fig. 3, with an integration range | b | ≤ 10°): no halo field (blue curve), dipole field (black curve), and X-shape field (green curve). The red curve corresponds to the longitude profile of all nucleosynthesis positrons in the absence of propagation, assuming they annihilate in a medium with a positronium fraction of 0.95. The cyan curve corresponds to an analytical model obtained by model fitting to INTEGRAL/SPI observations and given only over the longitude range where data are constraining (see text). The difference in normalisation shows that the positron injection rates used in the model are overestimated by a factor ~2.
Current usage metrics show cumulative count of Article Views (full-text article views including HTML views, PDF and ePub downloads, according to the available data) and Abstracts Views on Vision4Press platform.
Data correspond to usage on the plateform after 2015. The current usage metrics is available 48-96 hours after online publication and is updated daily on week days.
Initial download of the metrics may take a while.