Fig. 1
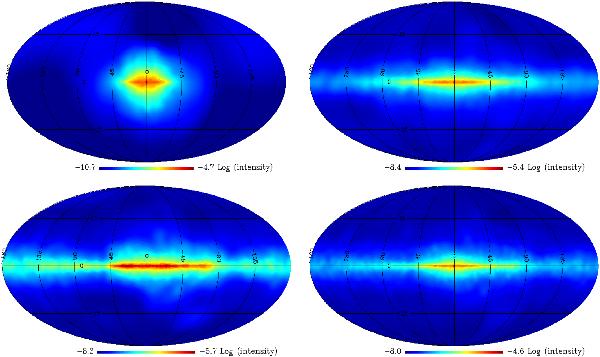
Simulated all-sky maps of the 511 keV intensity distribution (in ph cm-2 s-1 sr-1) for 56Ni positrons with the dipole halo field configuration and an SN Ia escape fraction of 5%. The maps correspond to the 511 keV emission of positrons produced in the ellipsoidal bulge component (top left), the holed exponential component (top right), the SFD component (bottom left), and the entire Galaxy (by summing the three previous all-sky maps; bottom right).

Current usage metrics show cumulative count of Article Views (full-text article views including HTML views, PDF and ePub downloads, according to the available data) and Abstracts Views on Vision4Press platform.
Data correspond to usage on the plateform after 2015. The current usage metrics is available 48-96 hours after online publication and is updated daily on week days.
Initial download of the metrics may take a while.