Fig. 9
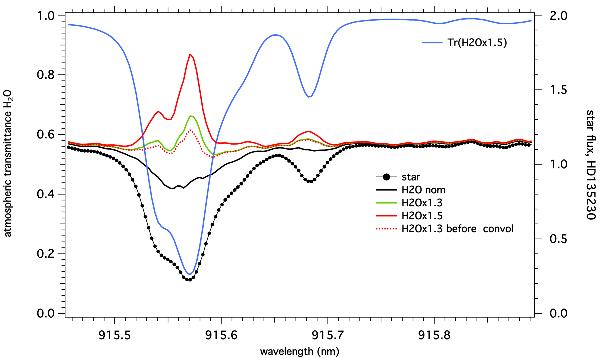
Here, the wavelength shift is very low (no P cygni), therefore the wavelength scale is accurate. The solid black line is the TAPAS corrected with the nominal H2O column. While it is adequate in the H2O line at right, it is not enough for the lines on the left. See text for discussion. The red dotted line is the exact calculation with 1.3 times the nominal H2O column, while the green line is the approximate calculation. There is a significant difference at 915.57 nm where the observed H2O absorption is almost 85%. The TAPAS transmission spectrum is in blue, at the top, left scale, computed for 1.5 the nominal H2O content.
Current usage metrics show cumulative count of Article Views (full-text article views including HTML views, PDF and ePub downloads, according to the available data) and Abstracts Views on Vision4Press platform.
Data correspond to usage on the plateform after 2015. The current usage metrics is available 48-96 hours after online publication and is updated daily on week days.
Initial download of the metrics may take a while.