Fig. 8
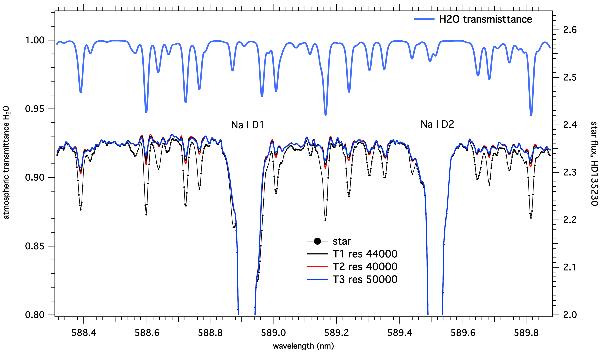
Water vapor lines in the region of D1 and D2 sodium lines. The TAPAS transmission spectrum is in blue, at the top. All lines of the model are seen in the star spectrum. The corrected spectrum has three versions with 3 different resolutions. Regardless of the spectral resolution chosen to compute the TAPAS spectrum, there are residual absorption features that indicate that the quantity of H2O in the model is less than in reality.
Current usage metrics show cumulative count of Article Views (full-text article views including HTML views, PDF and ePub downloads, according to the available data) and Abstracts Views on Vision4Press platform.
Data correspond to usage on the plateform after 2015. The current usage metrics is available 48-96 hours after online publication and is updated daily on week days.
Initial download of the metrics may take a while.