Fig. 5
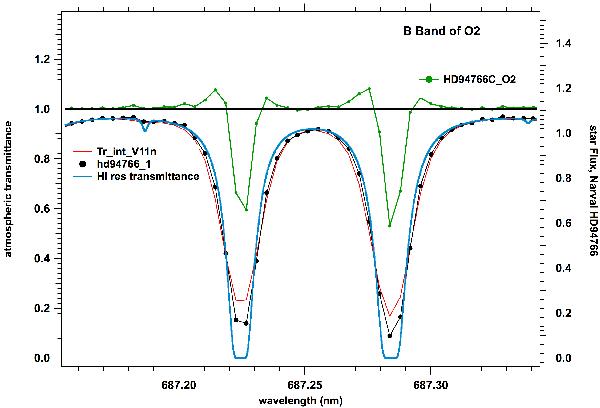
Piece of Narval spectrum of HD 94766 in the B band where two lines of O2 showing shoulders and a self-reversal. The black line with dots is the original spectrum (right scale), the green line with dots is the corrected spectrum after division by the convoluted transmittance. The red line is the TAPAS transmittance convoluted to a resolution of 66 000. The transmittance at high resolution is also plotted (blue), showing that both lines are saturated at the center, and the exact value of the 4 central spectels of the corrected spectrum is somewhat meaningless. There are no H2O absorption features in this range.
Current usage metrics show cumulative count of Article Views (full-text article views including HTML views, PDF and ePub downloads, according to the available data) and Abstracts Views on Vision4Press platform.
Data correspond to usage on the plateform after 2015. The current usage metrics is available 48-96 hours after online publication and is updated daily on week days.
Initial download of the metrics may take a while.