Fig. 3
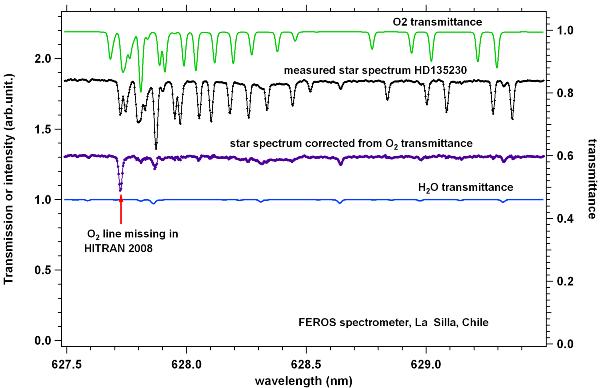
Green curve: the O2 transmittance computed by TAPAS and convoluted for the appropriate resolution of 44 000, in a narrow spectral interval where O2 lines are present (right scale). Black curve (left scale): the star spectrum showing absorption lines due to telluric O2, shifted from the TAPAS transmission, because the FEROS wavelength calibration put the star spectrum in the barycentric solar system reference. Dark purple curve: star spectrum divided by the convoluted transmittance, after proper wavelength shift (left scale, but vertically displaced for clarity). A conspicuous line remaining corresponds to an O2 line absent from the HITRAN 2008 database. Other small wiggles correspond to weak H2O lines, as indicated by the light blue curve (H2O only TAPAS transmittance, left scale).
Current usage metrics show cumulative count of Article Views (full-text article views including HTML views, PDF and ePub downloads, according to the available data) and Abstracts Views on Vision4Press platform.
Data correspond to usage on the plateform after 2015. The current usage metrics is available 48-96 hours after online publication and is updated daily on week days.
Initial download of the metrics may take a while.