Fig. 11
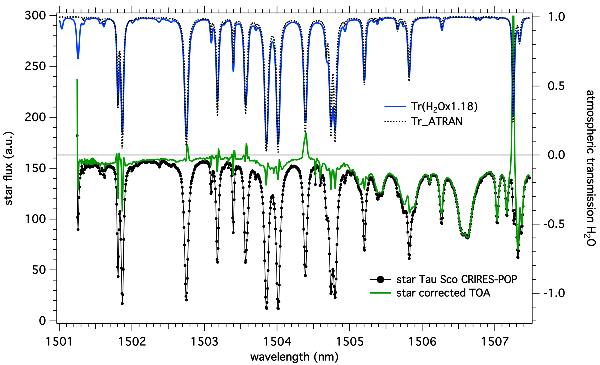
TAPAS comparison to a star spectrum in the near-infrared. The black curve with dots (bottom, left scale) is a spectrum of a B 0.2 V star (tau Sco) acquired by CRIRES at VLT on February 27, 2010, at 09/10/40 UTC (arbitrary unit). Blue curve (top, right scale): TAPAS retrieved atmospheric transmission of H2O with a resolution of 60 000 and a quantity of H2O multiplied by 1.18. Some lines are overcorrected by TAPAS/HITRAN, in particular at 1507.25 nm. Black dashed line: synthetic model from ATRAN web site. One line at 1501.26 nm is absent in ATRAN. The wavelength scale is in nm and in vacuum.
Current usage metrics show cumulative count of Article Views (full-text article views including HTML views, PDF and ePub downloads, according to the available data) and Abstracts Views on Vision4Press platform.
Data correspond to usage on the plateform after 2015. The current usage metrics is available 48-96 hours after online publication and is updated daily on week days.
Initial download of the metrics may take a while.