Fig. 10
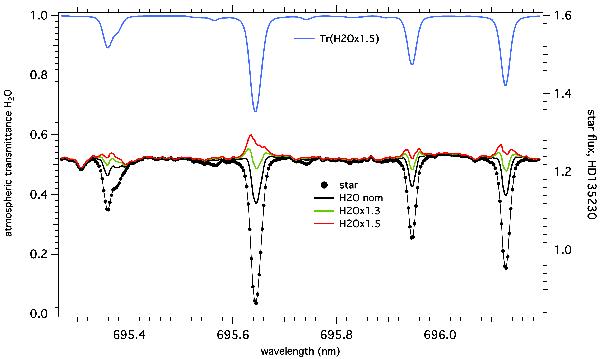
Observed star spectrum (with dots where sampled) corrected from the H2O transmission computed by TAPAS with the nominal value of H2O (black curve), and also with 1.3 (green) and 1.5 the nominal H2O value. The remaining self-reversal is a sign of inadequate resolution/line width. Even over this small spectral interval, it seems that the adequate factor to obtain a featureless spectrum after correction would need a different quantity of H2O: while at 695.36 nm, the factor 1.3 would be approximately correct (green curve), it is too large at 695.64 nm. The TAPAS transmission spectrum is in blue, at the top, left scale, computed for 1.5 the nominal H2O content.
Current usage metrics show cumulative count of Article Views (full-text article views including HTML views, PDF and ePub downloads, according to the available data) and Abstracts Views on Vision4Press platform.
Data correspond to usage on the plateform after 2015. The current usage metrics is available 48-96 hours after online publication and is updated daily on week days.
Initial download of the metrics may take a while.