Fig. 1
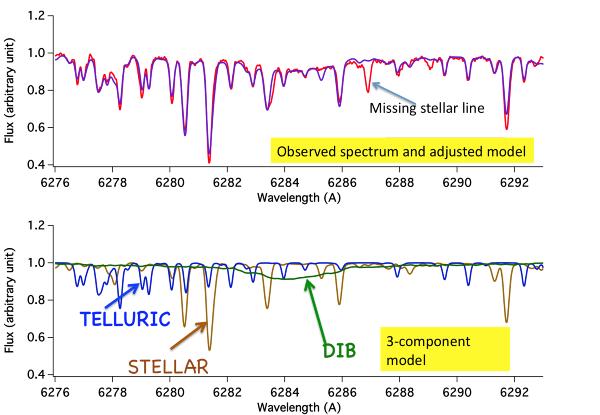
Illustration of data-model adjustment using TAPAS spectra: a high-resolution (R = 65 000) stellar spectrum is shown in the region of the 628.4 nm DIB (top). Data (in red) have been recorded from the Paranal Observatory with the FLAMES-UVES spectrograph at the VLT and adjusted to the convolved product (blue line) of three models shown at bottom: a stellar model computed for the appropriate stellar parameters (brown line), a telluric transmission (blue) and a DIB empirical model (green). The use of the TAPAS transmission allows an optimal adjustment and estimate of the DIB equivalent width. It also allows revealing unambiguously missing lines in the stellar model, such as the feature at 628.7 nm (see Chen et al. 2013).
Current usage metrics show cumulative count of Article Views (full-text article views including HTML views, PDF and ePub downloads, according to the available data) and Abstracts Views on Vision4Press platform.
Data correspond to usage on the plateform after 2015. The current usage metrics is available 48-96 hours after online publication and is updated daily on week days.
Initial download of the metrics may take a while.