Fig. 5
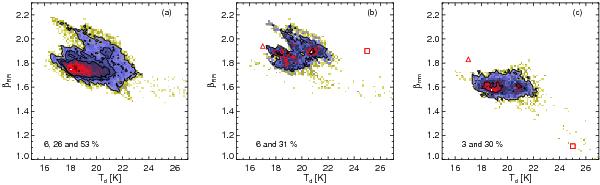
Dust spectral indices as a function of temperature. a) βFIR versus Td for the whole 24° × 8° region. b) βFIR versus Td for points where τ353 ≥ 4 × 10⁻⁴. c) βmm versus Td for points where τ353 ≥ 4 × 10⁻⁴. The triangle and square in panels b) and c) indicate the values obtained by fitting the emissivities predicted by the TLS model (Paradis et al. 2011) for Td = 17 and 25 K (see Sect. 6.1.2). The colour scale is logarithmic and it represents the density of points. The contours show the densities for the cumulated fractions, given by the values in each panel, of the data points, from red to yellow.
Current usage metrics show cumulative count of Article Views (full-text article views including HTML views, PDF and ePub downloads, according to the available data) and Abstracts Views on Vision4Press platform.
Data correspond to usage on the plateform after 2015. The current usage metrics is available 48-96 hours after online publication and is updated daily on week days.
Initial download of the metrics may take a while.