Fig. 10
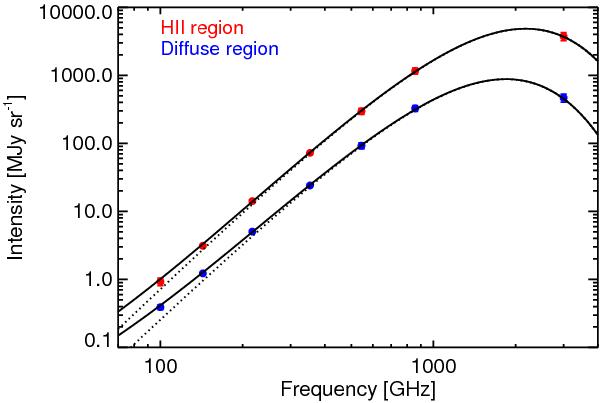
Spectra towards the H ii region complex W42 (red) and a diffuse region
in the Galactic plane centred at  (blue). The circles show the total intensity, with their corresponding
uncertainties. The dotted lines represent the modified blackbody model, where one
single opacity spectral index is fitted to IRAS 100 μm and HFI 857,
545, and 353 GHz data. The solid lines represent the total emission, including the
contribution from metallic dust particles (Draine
& Hensley 2013), at the same temperature Td. This
contribution to the total emission at 100 GHz is 41% and 63% for the H ii
and diffuse regions, respectively.
(blue). The circles show the total intensity, with their corresponding
uncertainties. The dotted lines represent the modified blackbody model, where one
single opacity spectral index is fitted to IRAS 100 μm and HFI 857,
545, and 353 GHz data. The solid lines represent the total emission, including the
contribution from metallic dust particles (Draine
& Hensley 2013), at the same temperature Td. This
contribution to the total emission at 100 GHz is 41% and 63% for the H ii
and diffuse regions, respectively.
Current usage metrics show cumulative count of Article Views (full-text article views including HTML views, PDF and ePub downloads, according to the available data) and Abstracts Views on Vision4Press platform.
Data correspond to usage on the plateform after 2015. The current usage metrics is available 48-96 hours after online publication and is updated daily on week days.
Initial download of the metrics may take a while.