Fig. 5
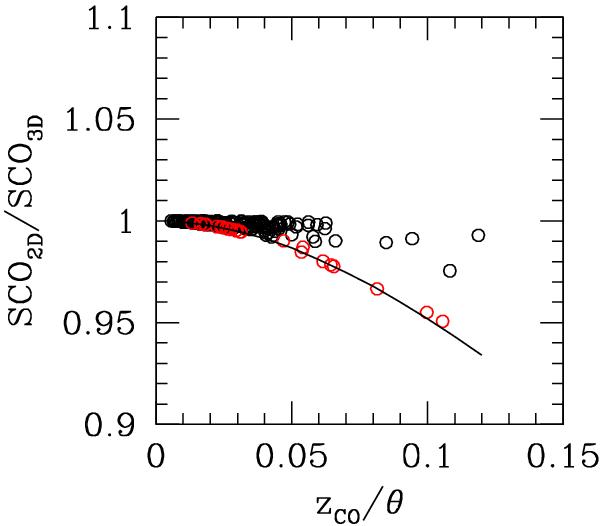
Relationship between the ratio of the 2D (Eq. (9)) vs. 3D (Eq. (12)) aperture corrections SCO2D/SCO3D and the ratio of the molecular gas scale height of the disc to the beam size zCO/θ for the HRS galaxies of the sample. Black open circles are for galaxies with an inclination ≤80 deg, red symbols for edge-on systems (i > 80 deg). The black solid line gives the relation determined for model edge–on galaxies.
Current usage metrics show cumulative count of Article Views (full-text article views including HTML views, PDF and ePub downloads, according to the available data) and Abstracts Views on Vision4Press platform.
Data correspond to usage on the plateform after 2015. The current usage metrics is available 48-96 hours after online publication and is updated daily on week days.
Initial download of the metrics may take a while.