Fig. 1
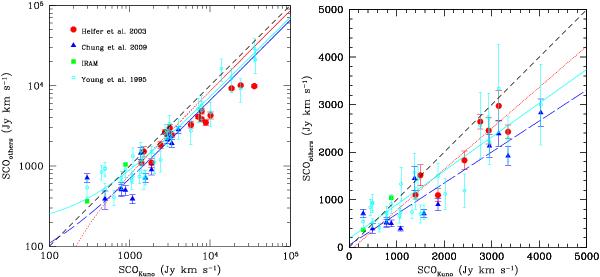
Comparison between the integrated SCO fluxes determined by Kuno et al. (2007) and those determined by Helfer et al. (2003; red filled dots), Chung et al. (2009a; blue filled triangles), our own observations of the two galaxies NGC 4548 and NGC 4579 with the IRAM radiotelescope (green filled squares) and the extrapolated fluxes of the FCRAO survey (Young et al. 1995; cyan empty circles) on logarithmic scale for all galaxies in common (left) and on linear scale for those objects with SCO in the range 100–5000 Jy km s-1 sampled by the HRS (right). The linear best fit to the data, determined assuming the Kuno et al. (2007) data as independent variable in the range 100–5000 Jy km s-1, are shown by the red dotted line (Helfer et al. 2003), the blue long dashed line (Chung et al. 2009a) and the cyan solid line (Young et al. 1995). The short dashed black line shows the 1:1 relationships.
Current usage metrics show cumulative count of Article Views (full-text article views including HTML views, PDF and ePub downloads, according to the available data) and Abstracts Views on Vision4Press platform.
Data correspond to usage on the plateform after 2015. The current usage metrics is available 48-96 hours after online publication and is updated daily on week days.
Initial download of the metrics may take a while.