Fig. 7
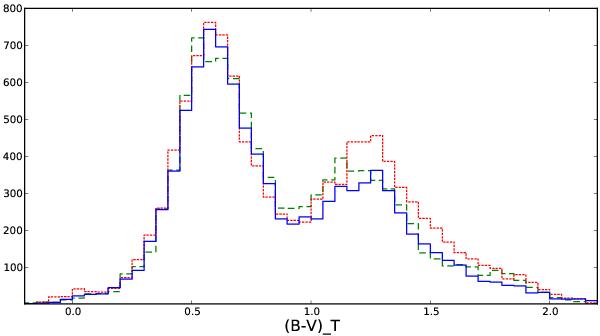
(B − V)T distributions towards the Galactic north pole showing the effect of changing the age–velocity dispersion relation (AVR) against the default model B. Tycho-2 data (dashed green line) and the simulations based on the default model B (solid blue line) are shown. The dotted red line is based on simulations using an AVR of Holmberg et al. (2009) rather than of Gómez et al. (1997) but leaving all other parameters unchanged.
Current usage metrics show cumulative count of Article Views (full-text article views including HTML views, PDF and ePub downloads, according to the available data) and Abstracts Views on Vision4Press platform.
Data correspond to usage on the plateform after 2015. The current usage metrics is available 48-96 hours after online publication and is updated daily on week days.
Initial download of the metrics may take a while.