Free Access
Fig. 6
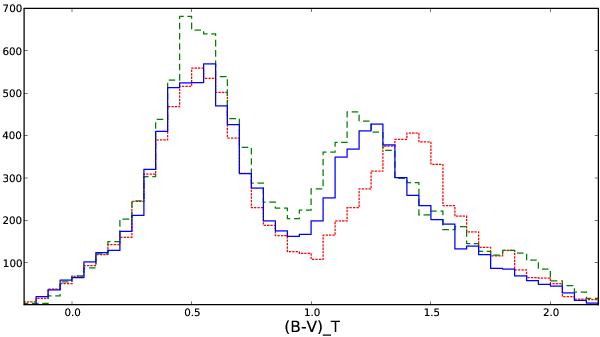
Testing atmosphere models. (B − V)T distributions in the reference region at intermediate latitudes. Tycho-2 data (dashed green line) is compared with the simulations obtained with the default model B and BaSeL 3.1 library (solid blue line) and the default model B and BaSeL 2.2 (dotted red line).
Current usage metrics show cumulative count of Article Views (full-text article views including HTML views, PDF and ePub downloads, according to the available data) and Abstracts Views on Vision4Press platform.
Data correspond to usage on the plateform after 2015. The current usage metrics is available 48-96 hours after online publication and is updated daily on week days.
Initial download of the metrics may take a while.