Fig. 8
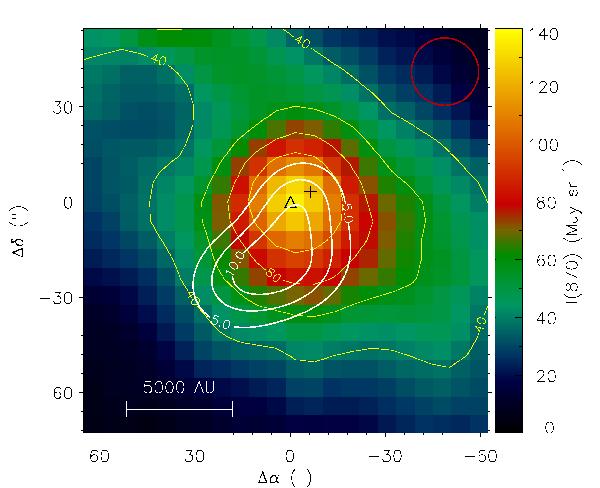
Column density map of the NH3(1,1) smoothed to an angular resolution of 21″ (contours) overlaid on the 870 μm map obtained with LABOCA (Belloche et al. 2011; Tsitali et al. 2013). The contour levels are 5, 7.5, and 10 × 1014 cm-2. The plus sign indicates the 1.2-mm dust emission peak Cha-MMS1a and the triangle shows the location of the Spitzer 24 μm source.
Current usage metrics show cumulative count of Article Views (full-text article views including HTML views, PDF and ePub downloads, according to the available data) and Abstracts Views on Vision4Press platform.
Data correspond to usage on the plateform after 2015. The current usage metrics is available 48-96 hours after online publication and is updated daily on week days.
Initial download of the metrics may take a while.