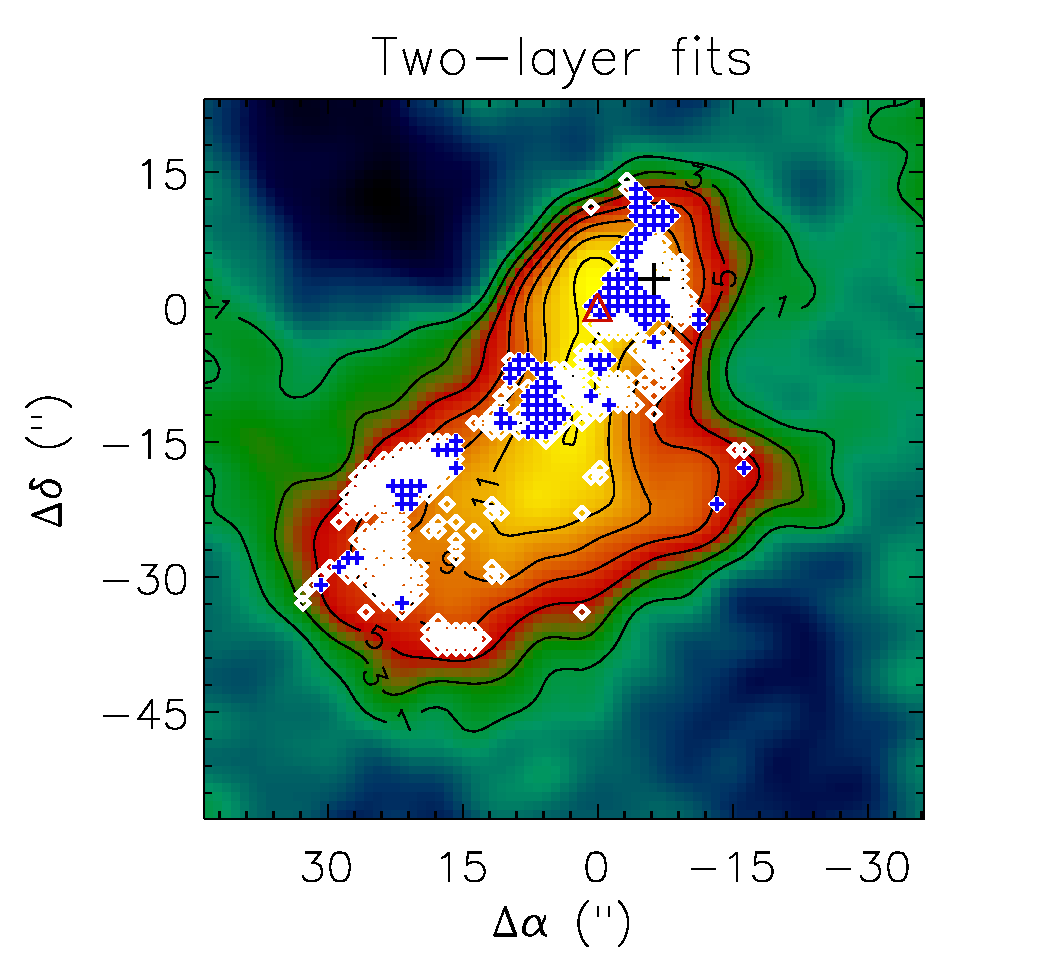
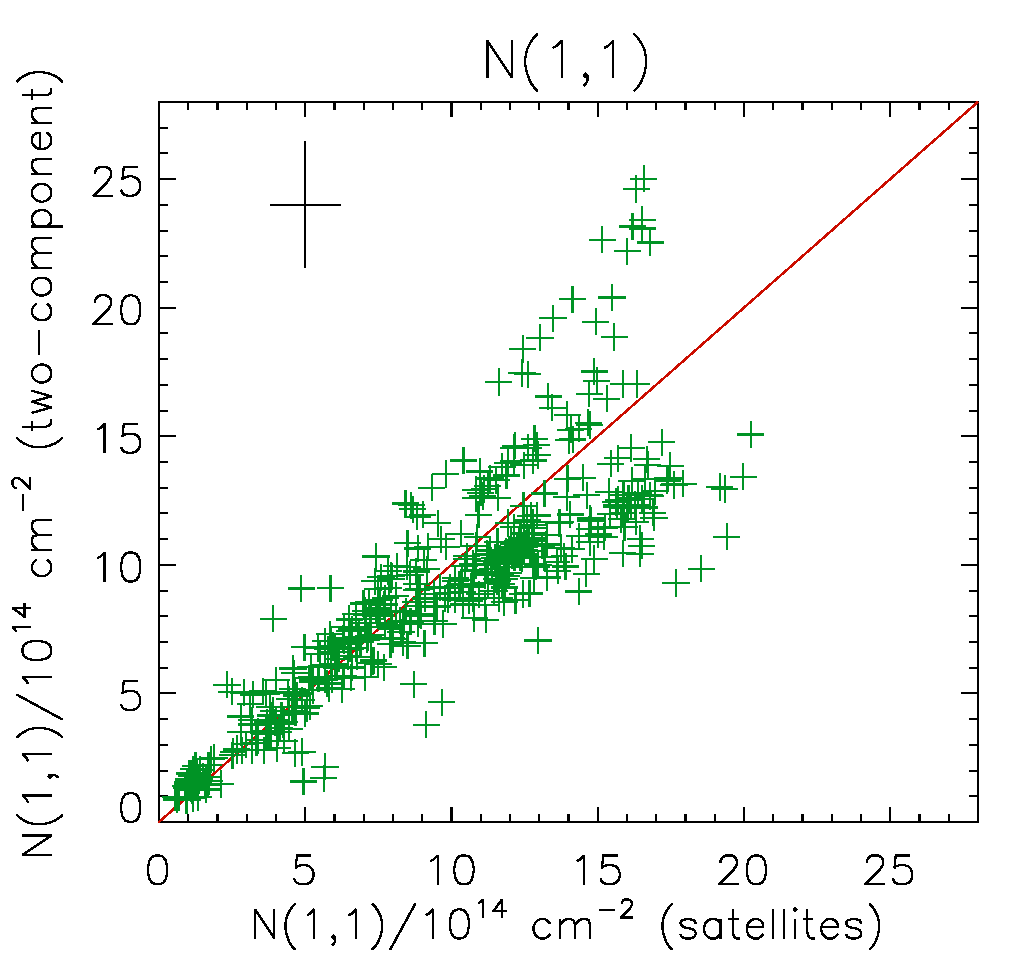
Fig. 6
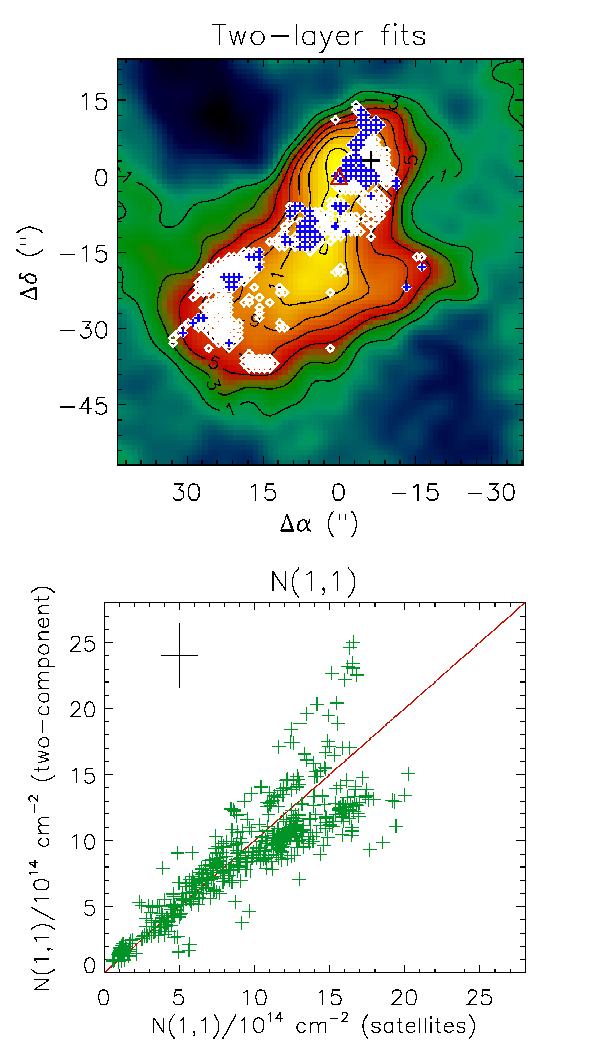
Top: the region where the two-layer fit (method C) is applicable is shown with white diamonds on the integrated brightness temperature map of the NH3(1,1) satellites. Blue plus signs indicate positions where Tex,bg> 11 K, i.e., where the excitation temperature of the background component exceeds the average kinetic temperature of the core. Bottom: comparison between the NH3(1,1) column densities derived by fits to the hyperfine satellites only (method B, x-axis) and two-layer fits (method C, y-axis). The average uncertainties of the points are indicated in the top left corner. The red line represents the one-to-one correlation.
Current usage metrics show cumulative count of Article Views (full-text article views including HTML views, PDF and ePub downloads, according to the available data) and Abstracts Views on Vision4Press platform.
Data correspond to usage on the plateform after 2015. The current usage metrics is available 48-96 hours after online publication and is updated daily on week days.
Initial download of the metrics may take a while.