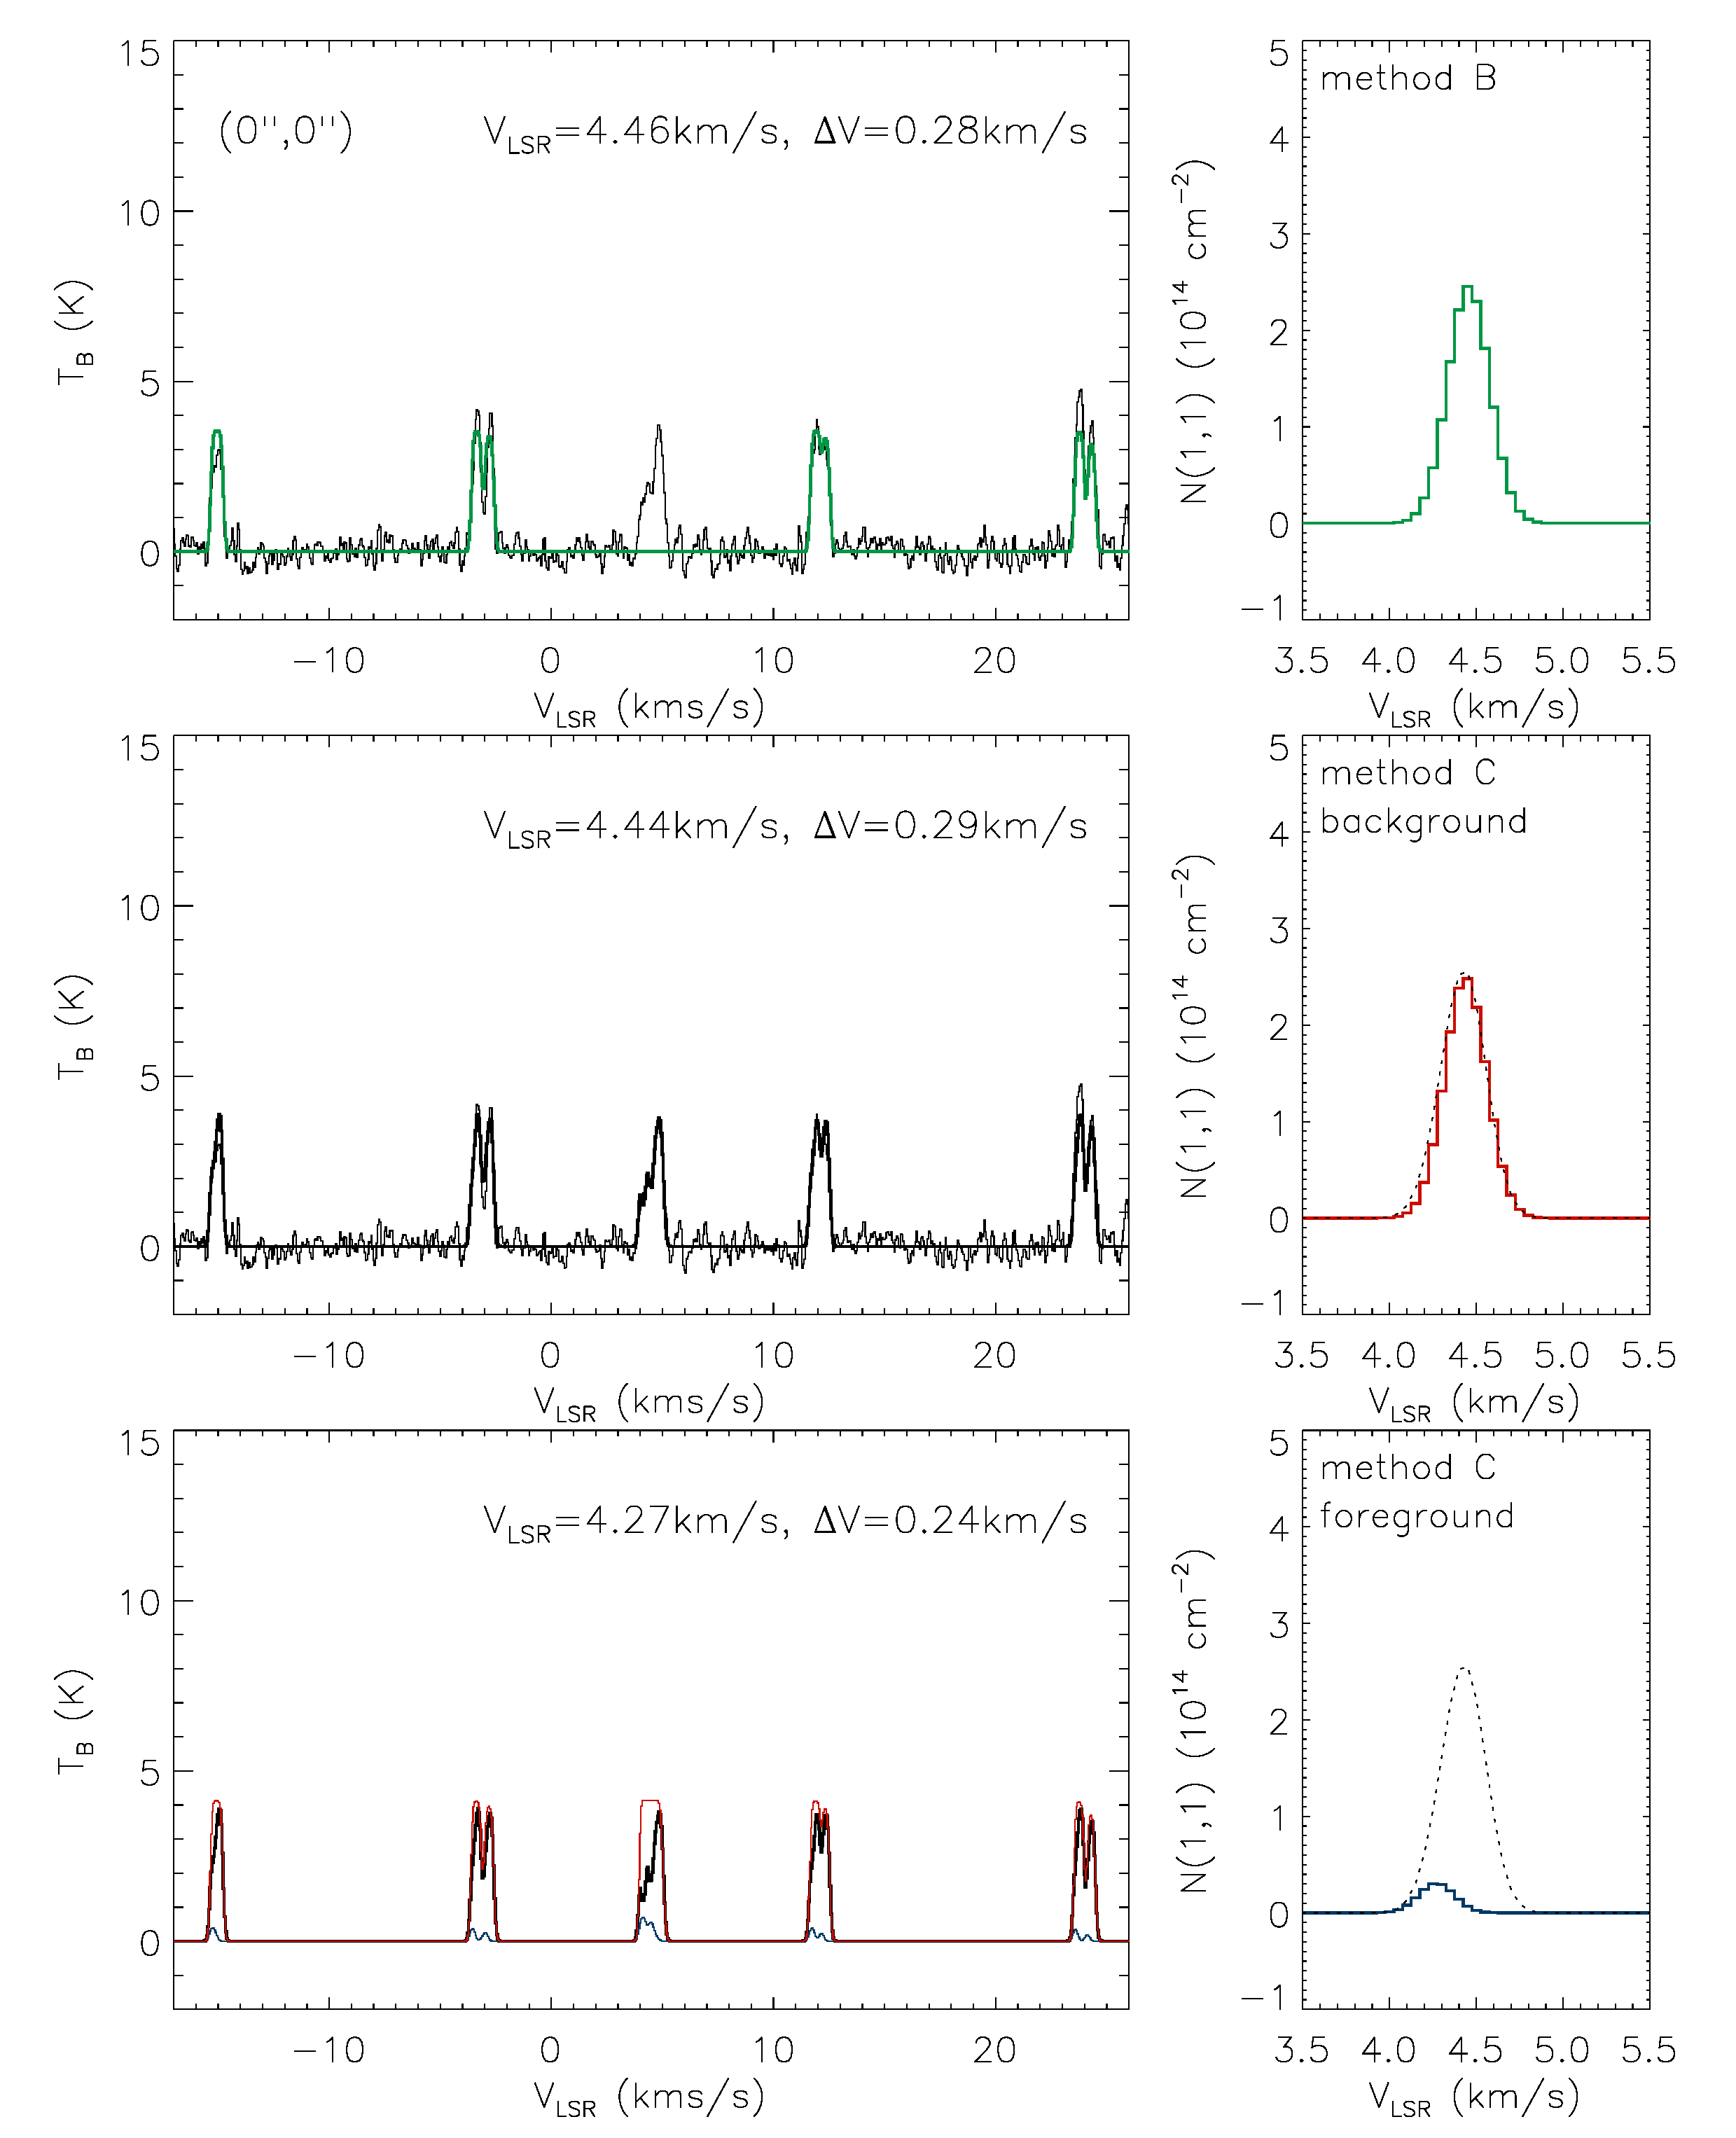
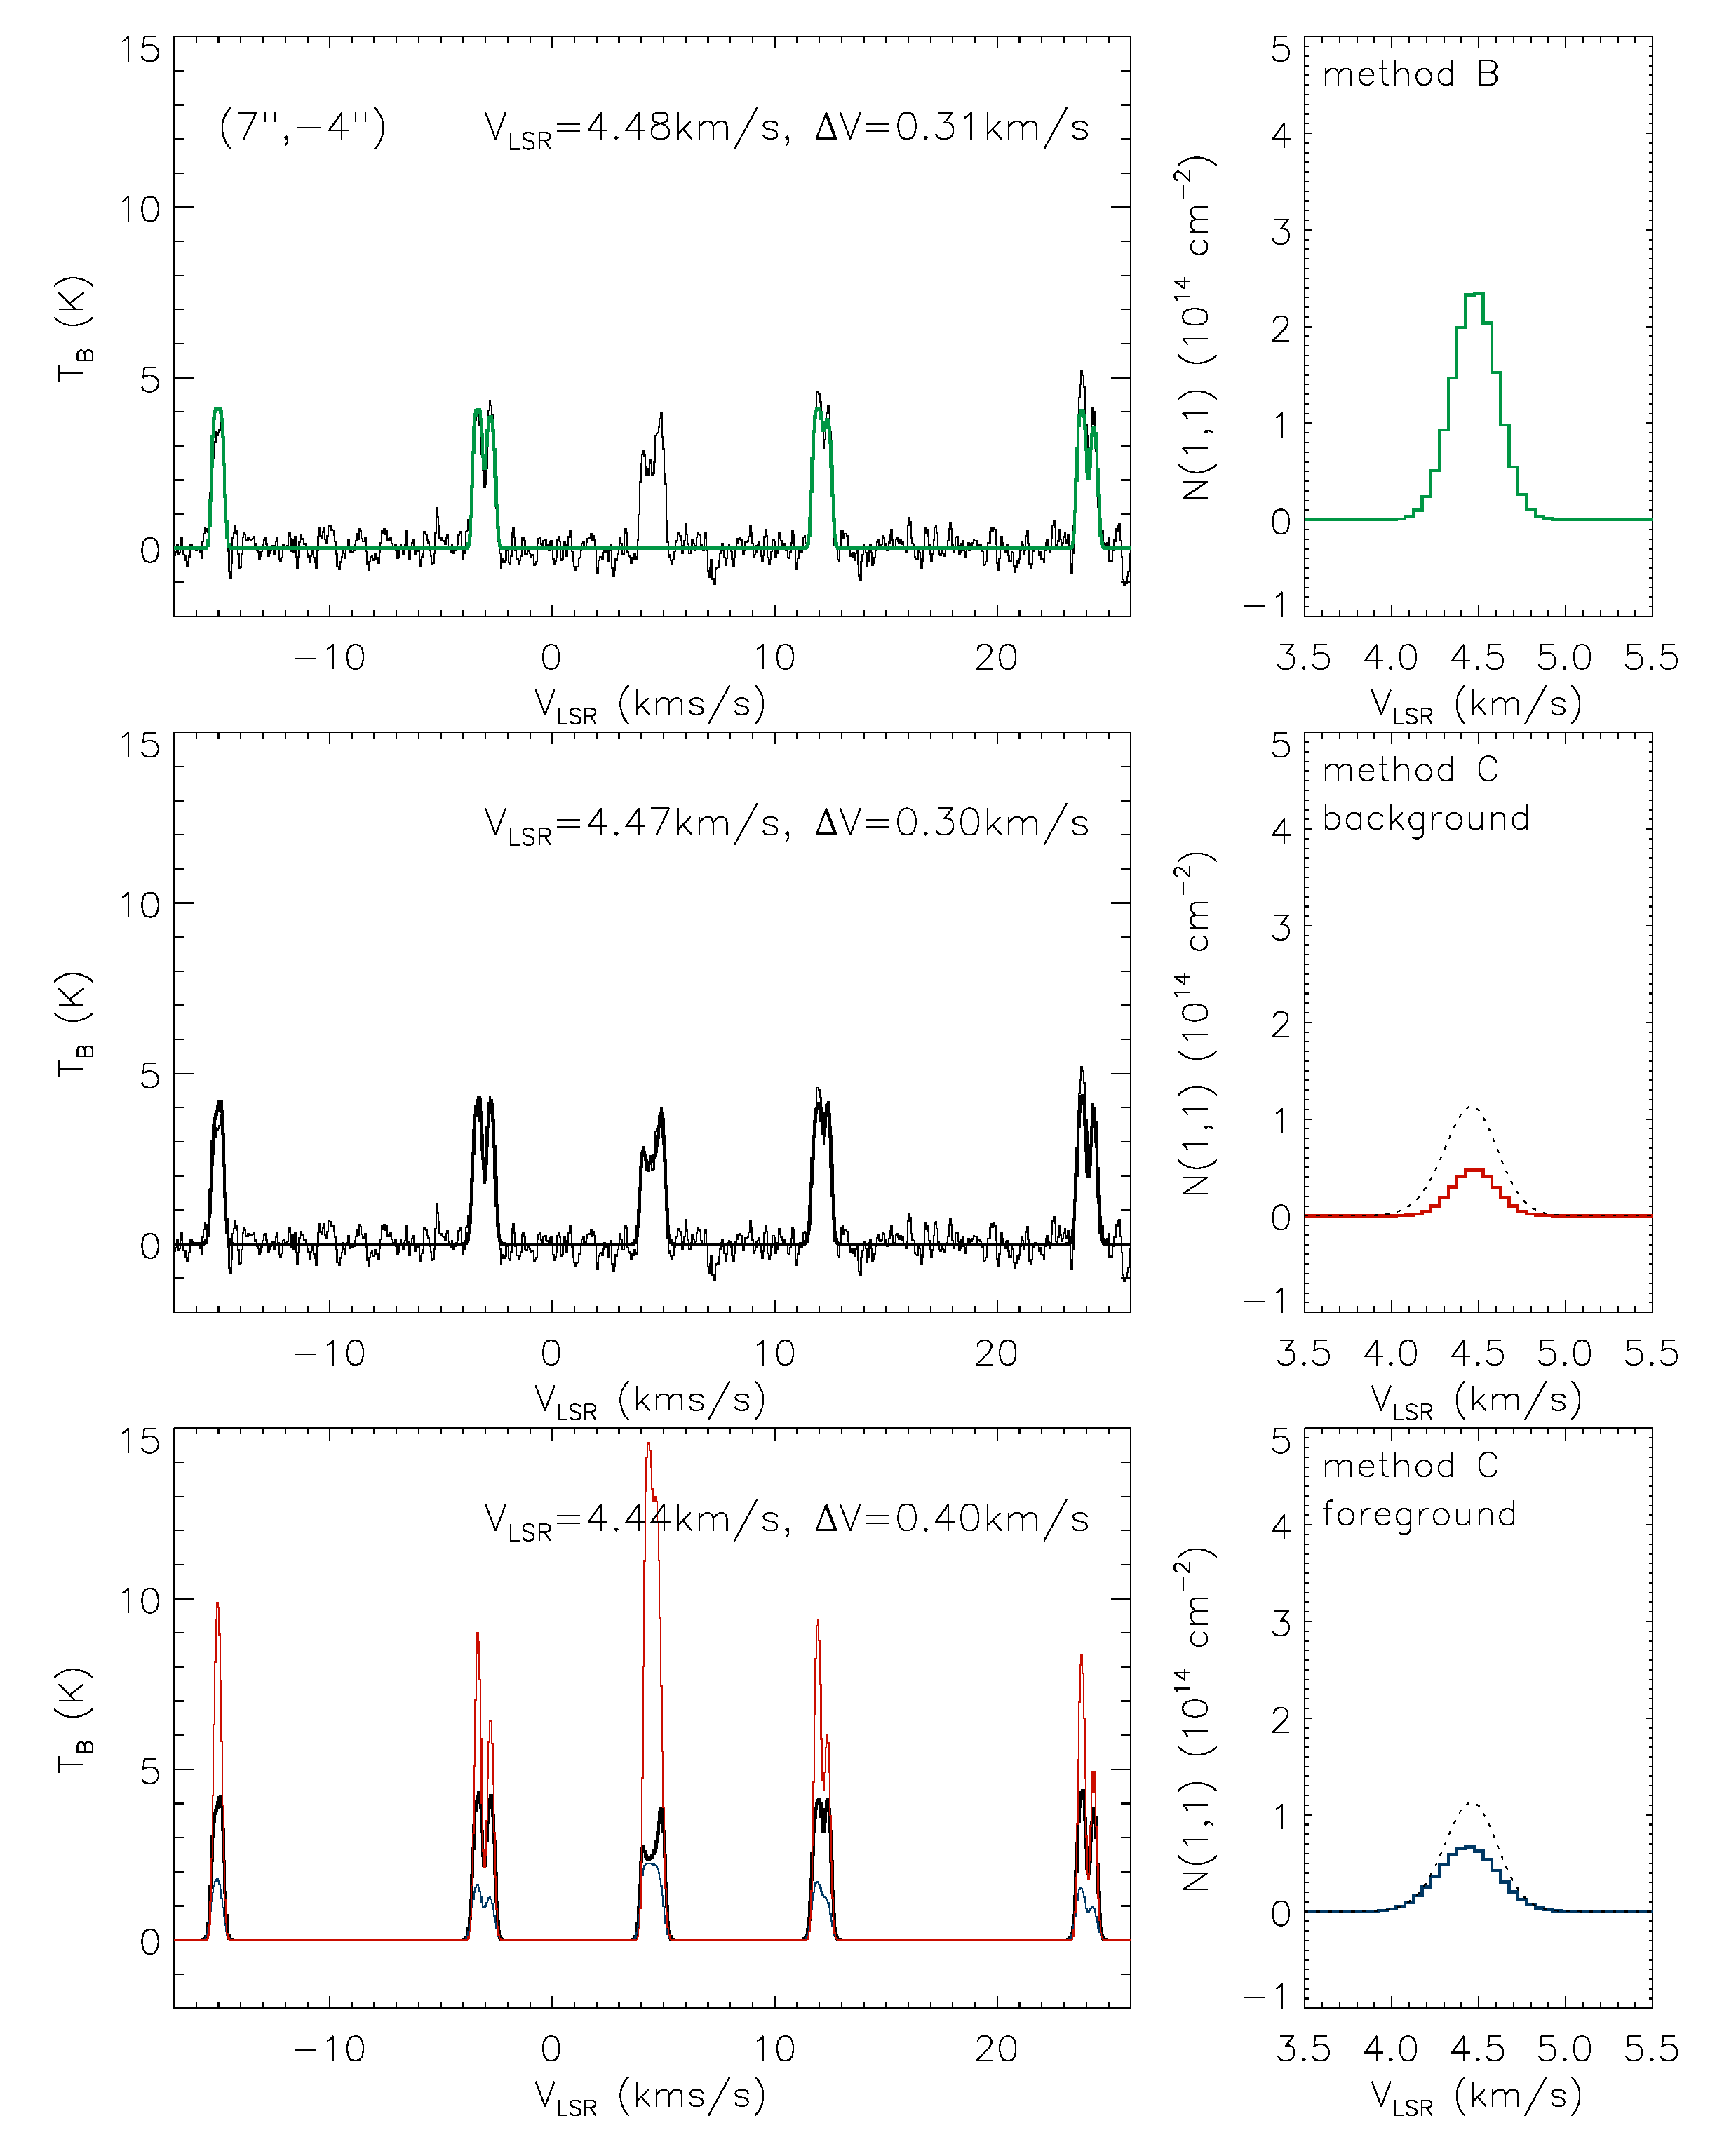
Fig. 5
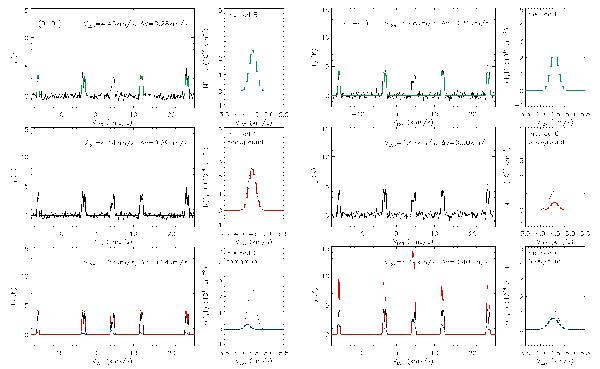
ATCA NH3(1,1) spectra towards the offsets (0″,0″) and (+ 7″, − 4″) from Cha-MMS1a. The latter position coincides with a Spitzer 24 μm emission peak. The top panels show a Gaussian fit to the four satellite groups of the hyperfine structure (green curve). The column density spectra of ammonia in the rotational level (1,1) derived from these fits are shown on the right of the satellite spectra. The panels in the middle row show two-component fits to the full hyperfine structure including the main group (black curve). In the bottom panels, the modelled emission profiles from the two layers (component 1: red, component 2: blue) are shown separately. The foreground component 2 has a lower excitation temperature than component 1, and causes absorption features. The corresponding NH3(1,1) column density spectra of components 1 (red) and 2 (blue) are shown on the right. The dashed curve shows the combined NH3(1,1) column density spectrum of layers 1 and 2.
Current usage metrics show cumulative count of Article Views (full-text article views including HTML views, PDF and ePub downloads, according to the available data) and Abstracts Views on Vision4Press platform.
Data correspond to usage on the plateform after 2015. The current usage metrics is available 48-96 hours after online publication and is updated daily on week days.
Initial download of the metrics may take a while.