Fig. 4
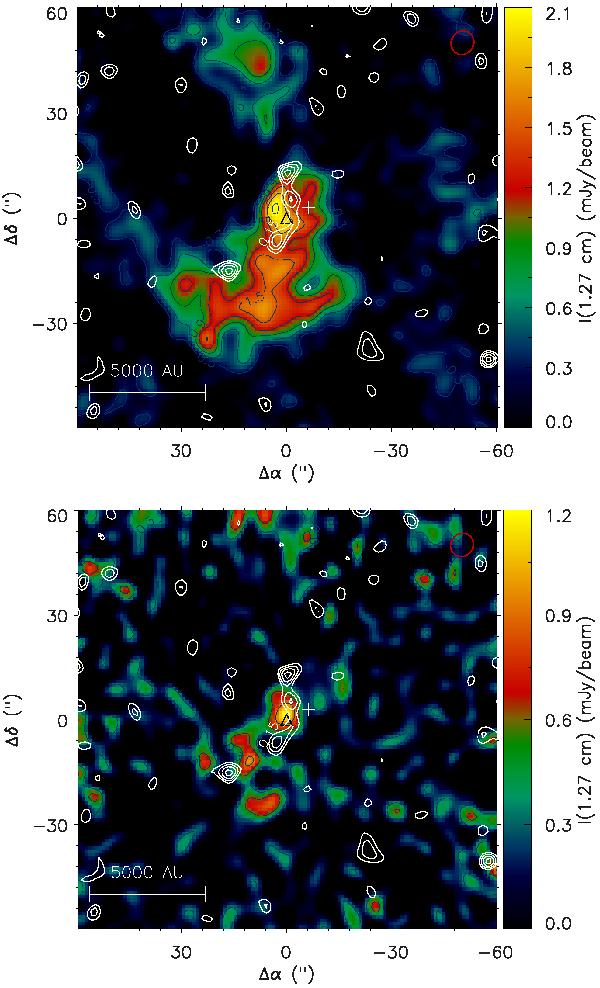
ATCA wide-band images. Top: the pixel image shows the intensity distribution of the two central channels covering the NH3(1,1) line. Bottom: the pixel image of the channel containing the (2,2) line. The contour map superimposed on both images represents the true 1.3 cm continuum emission, i.e. wide-band channels without ammonia line contamination. The positions of Cha-MMS1a and the Spitzer 24 μm maximum are marked with a plus sign and a triangle, respectively.
Current usage metrics show cumulative count of Article Views (full-text article views including HTML views, PDF and ePub downloads, according to the available data) and Abstracts Views on Vision4Press platform.
Data correspond to usage on the plateform after 2015. The current usage metrics is available 48-96 hours after online publication and is updated daily on week days.
Initial download of the metrics may take a while.