Fig. 3
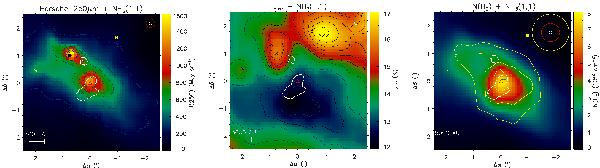
Left: intensity of thermal dust emission (MJy sr-1) at the wavelength λ = 250μm in a region of 5′ × 5′ region around Cha-MMS1. The map is centred at the Spitzer 24 μm peak indicated with a red triangle. The red circle in the top right corner corresponds to the average Herschel beamsize (FWHM, 18″) at 250 μm. The small white ellipse shows the synthesised ATCA beam (~7″). Middle: dust temperature, Tdust (K), in the same region. The red circle in the top right corner represents the resolution of the calculated Tdust and H2 column density maps (40″). Right: H2 column density, N(H2) (1022 cm-2) derived from the 250 μm optical thickness, τ250 μm. The dust temperature and column density maps are derived by fitting a modified blackbody function to the Herschel intensity maps at 500, 350, 250, and 160 μm assuming an emissivity index of β = 2.0 (see text). The locations of three prominent young stellar objects (YSOs), Ced110 IRS2 (right), IRS4 (middle), and IRS6 (left), are indicated with asterisks. The plus sign indicates the location of the millimetre source Cha-MMS1a (Reipurth et al. 1996). The white contour shows the integrated intensity level 5 K km s-1 of the NH3(1,1) satellites as observed with ATCA. The yellow contours in the right panel shows the integrated intensity ( ) of the NH3(1,1) line emission (K km s-1) observed at Parkes. The Parkes beam is shown with the large yellow circle in the top right corner.
Current usage metrics show cumulative count of Article Views (full-text article views including HTML views, PDF and ePub downloads, according to the available data) and Abstracts Views on Vision4Press platform.
Data correspond to usage on the plateform after 2015. The current usage metrics is available 48-96 hours after online publication and is updated daily on week days.
Initial download of the metrics may take a while.