Free Access
Fig. 2
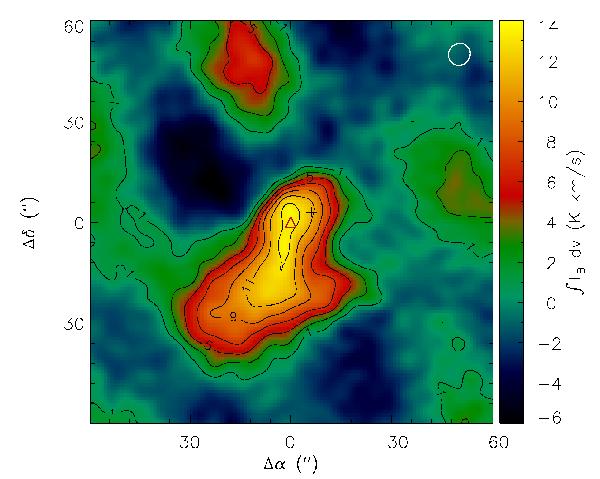
Integrated intensity map of the NH3(1,1) satellites towards Cha-MMS1 observed with ATCA. The positions of Cha-MMS1a and the Spitzer 24 μm maximum are marked with a plus sign and a triangle, respectively. The synthesised beam is indicated in the top right corner.
Current usage metrics show cumulative count of Article Views (full-text article views including HTML views, PDF and ePub downloads, according to the available data) and Abstracts Views on Vision4Press platform.
Data correspond to usage on the plateform after 2015. The current usage metrics is available 48-96 hours after online publication and is updated daily on week days.
Initial download of the metrics may take a while.