Fig. 12
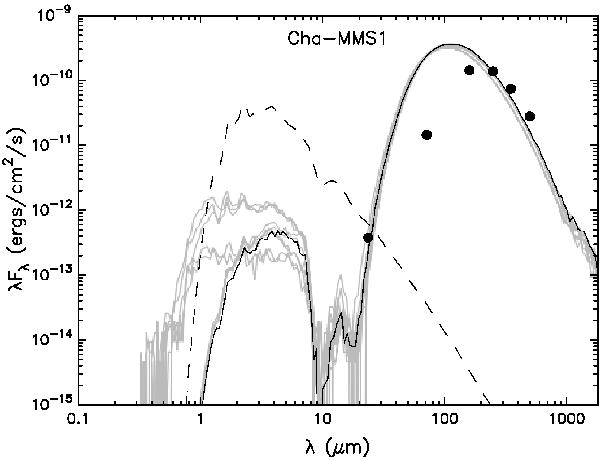
Spectral energy distribution for Cha-MMS1. The observed flux density values are shown as filled circles. The error bars are smaller than the data points in the figure. Ten best model fits are shown: the solid black line shows the best-fitting model, and the grey lines illustrate the subsequent nine best-fit models. The dashed line shows the SED of the stellar photosphere corresponding to the central source in the best-fitting model (in the absence of circumstellar material).
Current usage metrics show cumulative count of Article Views (full-text article views including HTML views, PDF and ePub downloads, according to the available data) and Abstracts Views on Vision4Press platform.
Data correspond to usage on the plateform after 2015. The current usage metrics is available 48-96 hours after online publication and is updated daily on week days.
Initial download of the metrics may take a while.