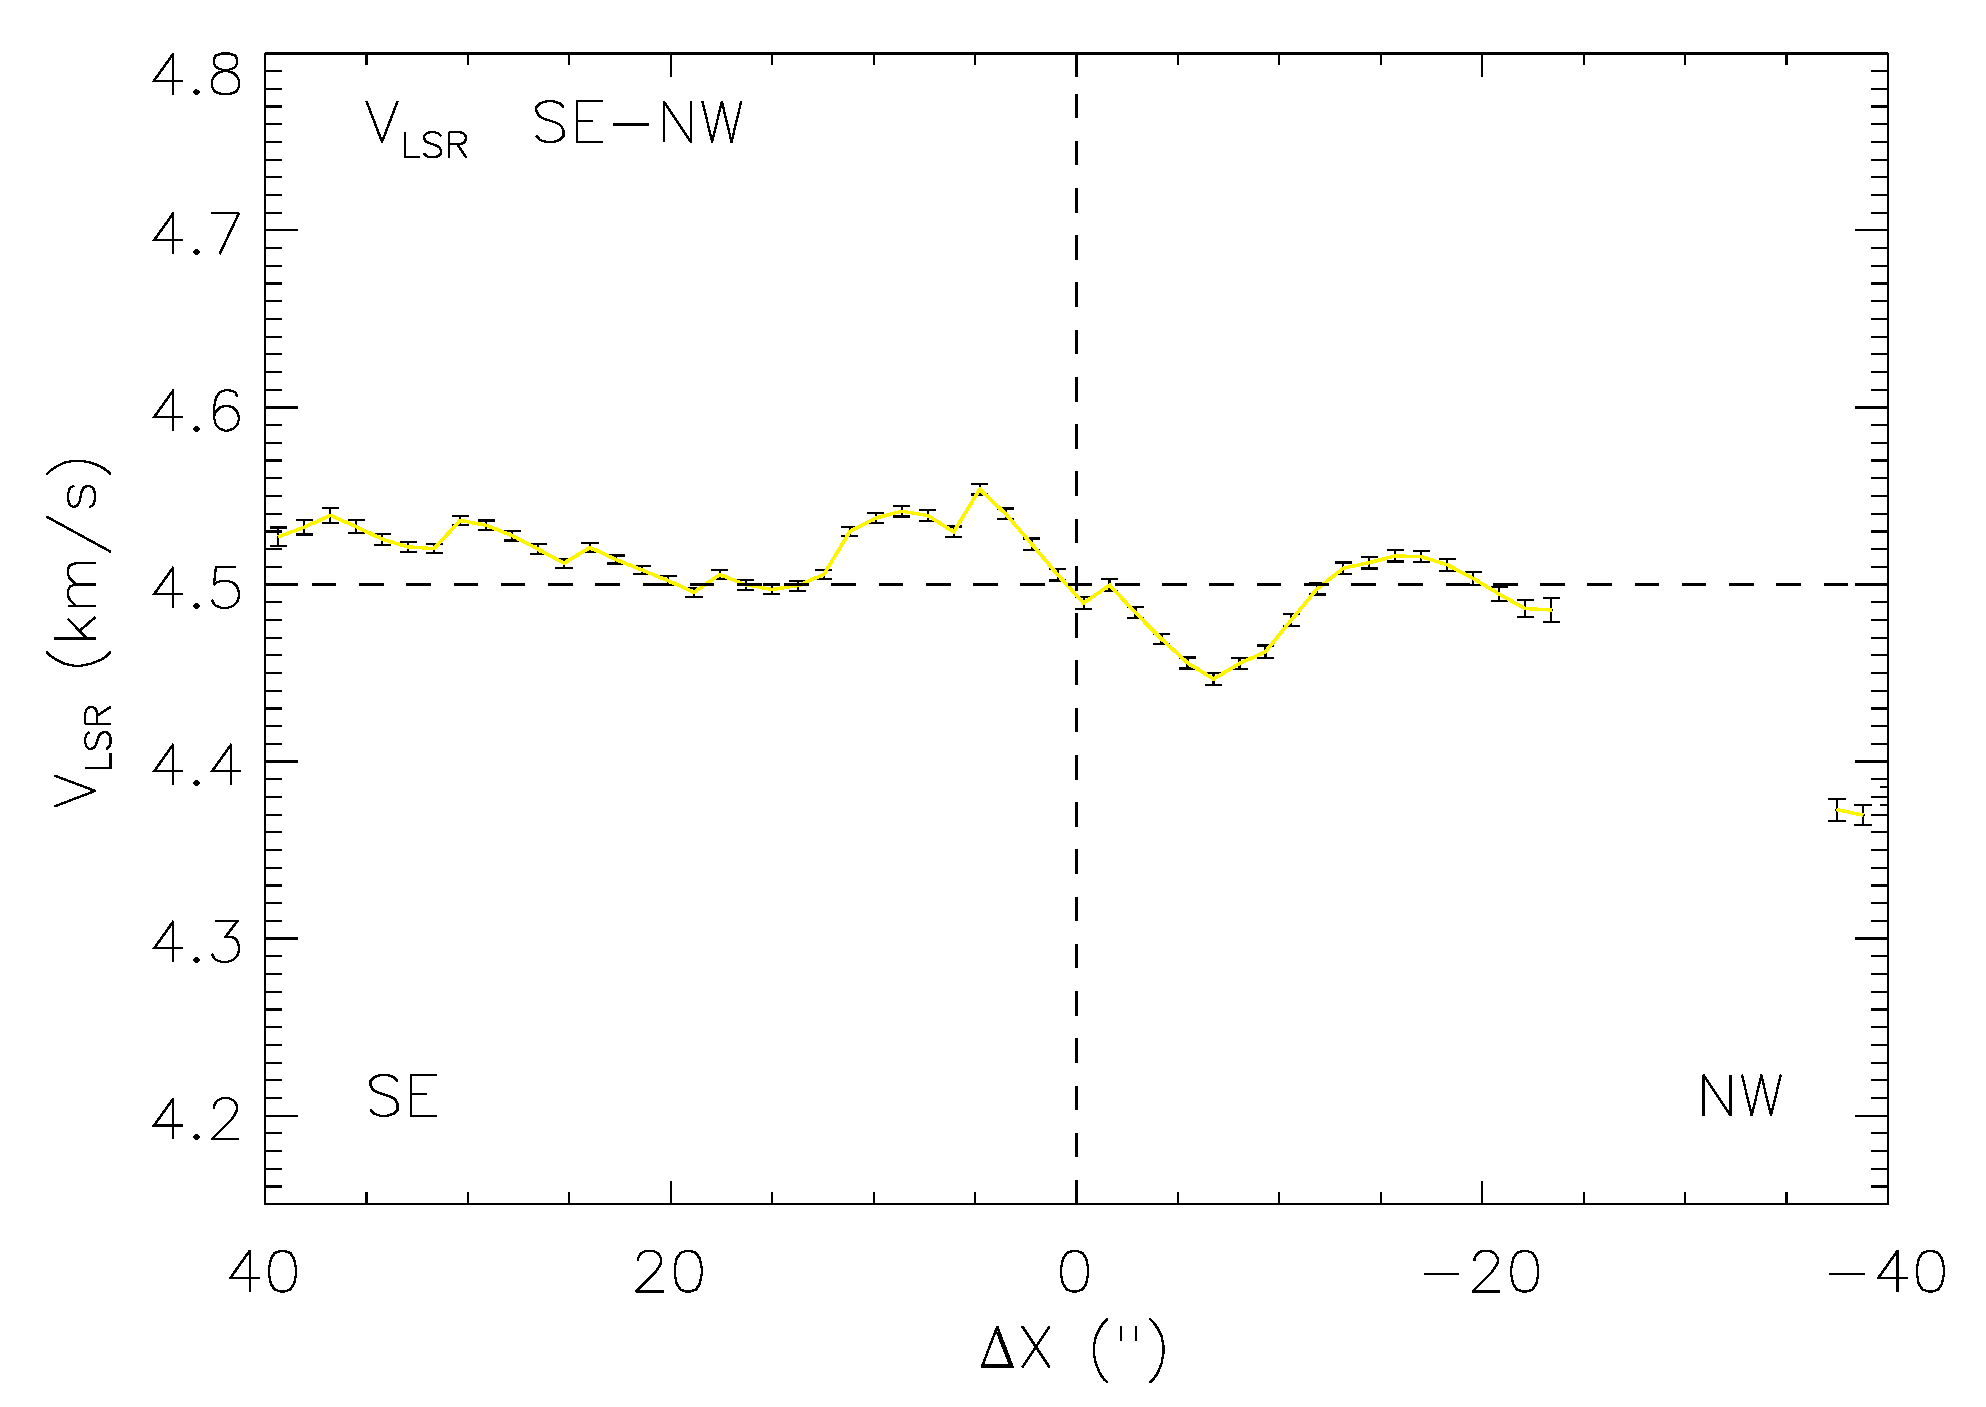
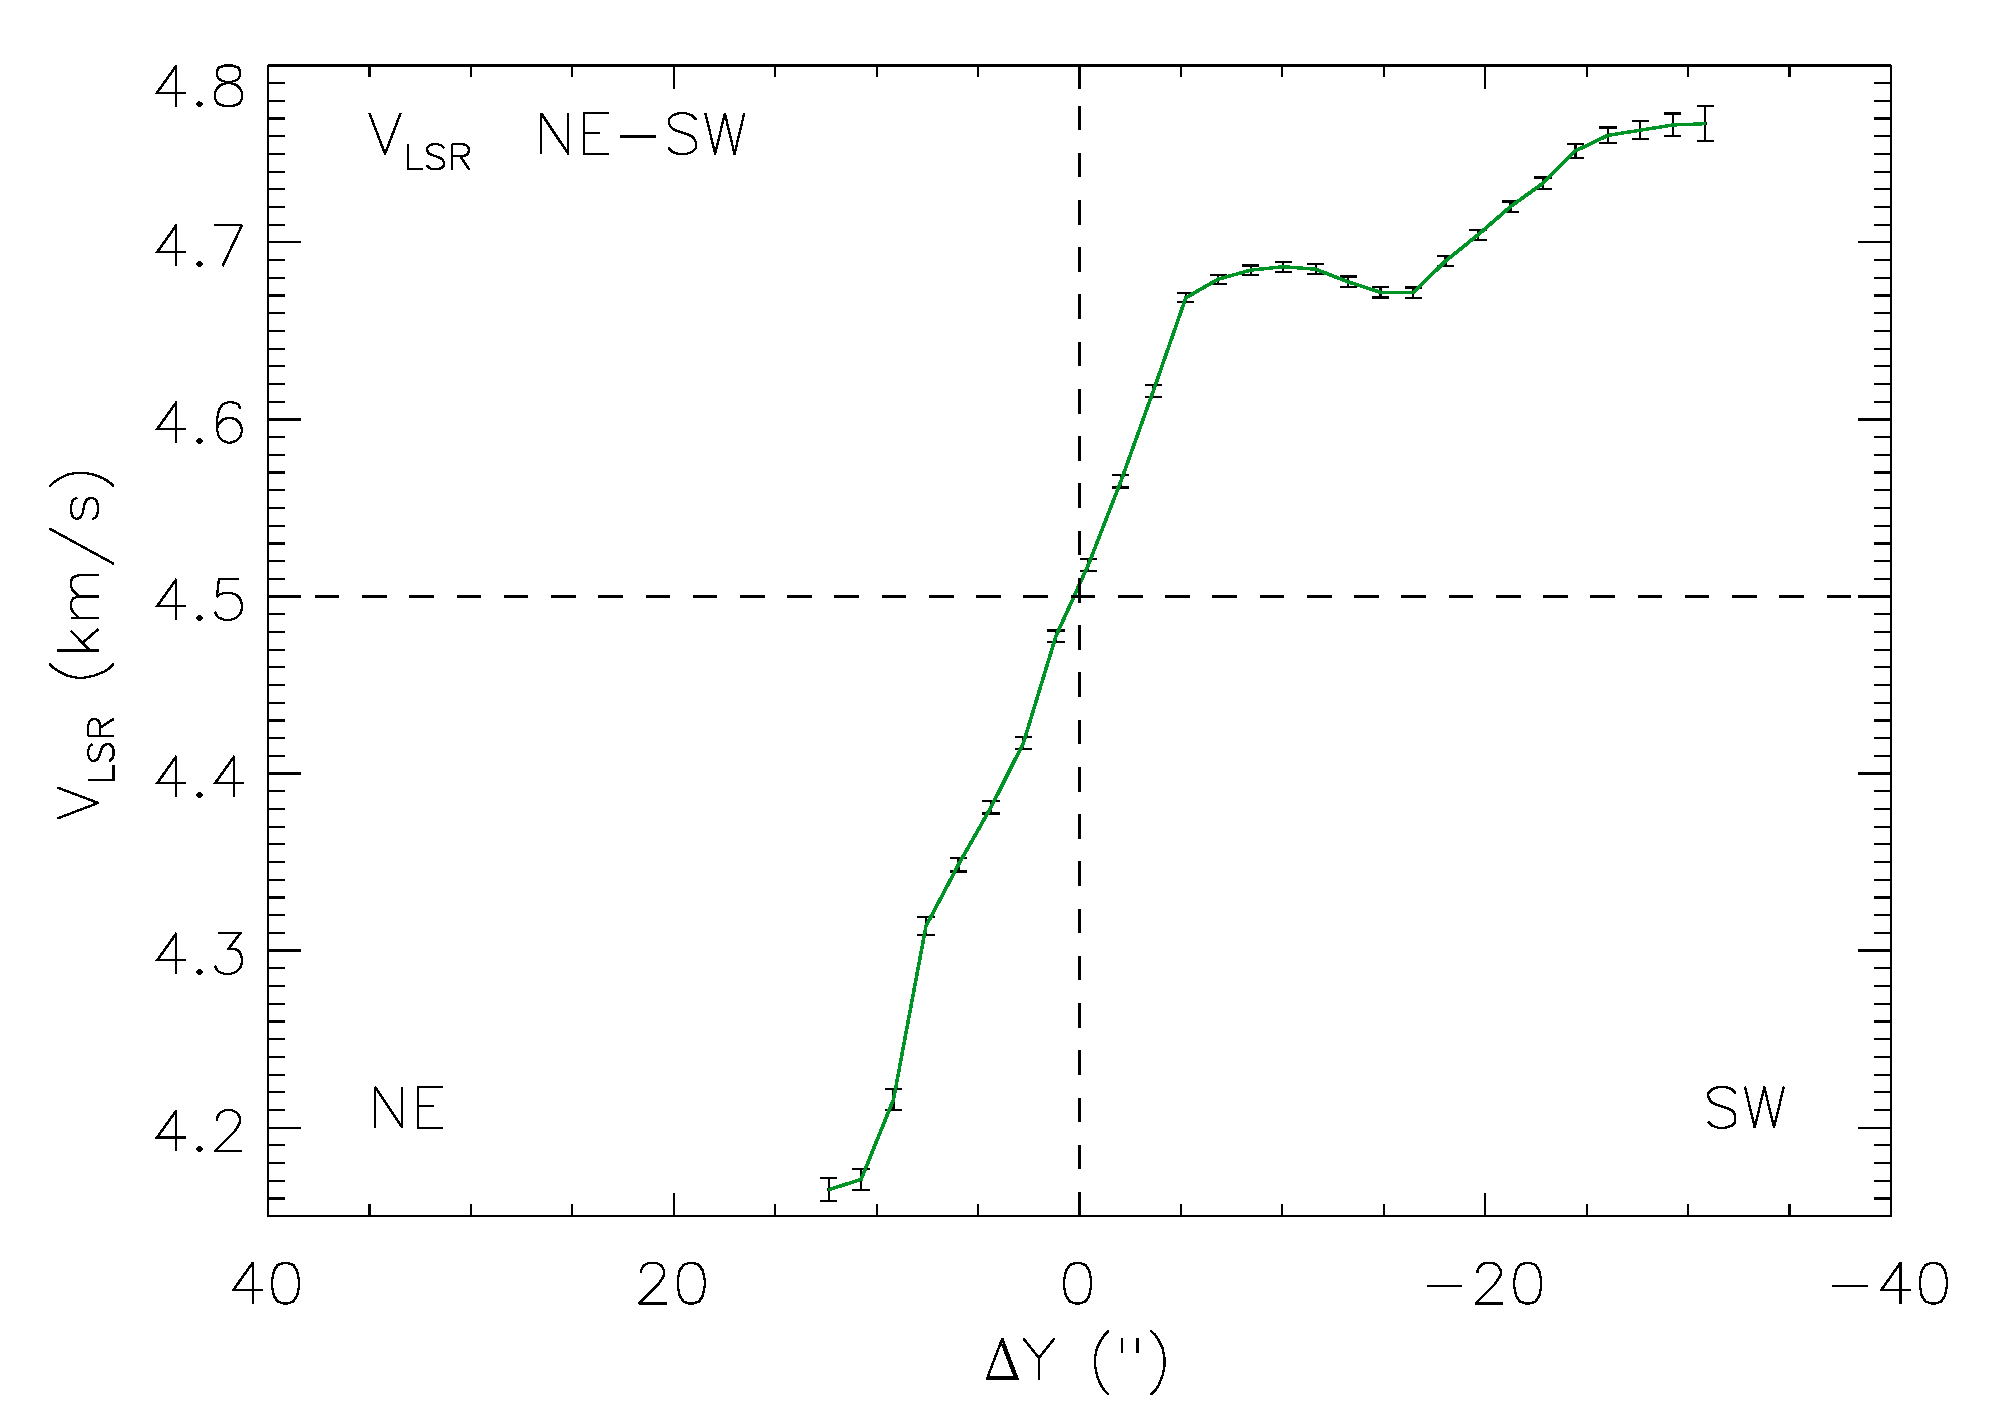
Fig. 10
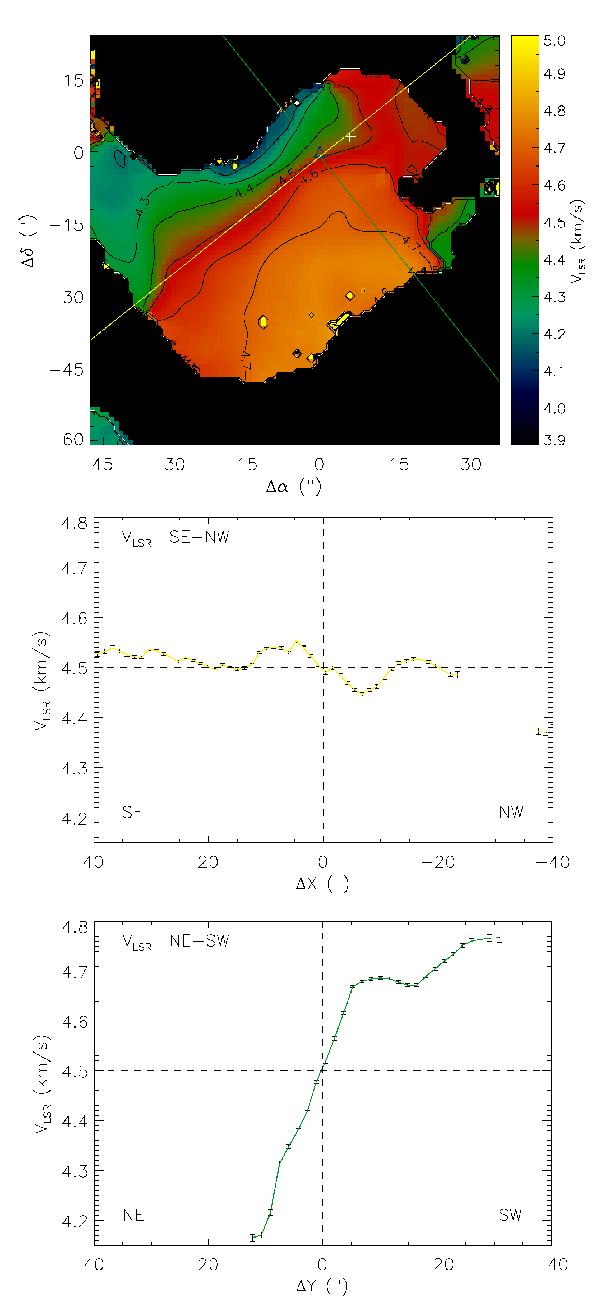
Distribution of the NH3(1,1) line velocities derived from Gaussian fits to the hyperfine structure. Top: the radial velocity map. The VLSR values can be read from the contours and the colour bar on the right. The locations of the Spitzer 24 μm source and the submm source Cha-MMS1a are shown with a triangle and a plus sign, respectively. Middle: velocity profile along the NW-SE oriented axis drawn in yellow on the map, Bottom: velocity profile along the NE-SW oriented axis indicated with green. Also the error bars result from Gaussian fits to the (1,1) hyperfine structure.
Current usage metrics show cumulative count of Article Views (full-text article views including HTML views, PDF and ePub downloads, according to the available data) and Abstracts Views on Vision4Press platform.
Data correspond to usage on the plateform after 2015. The current usage metrics is available 48-96 hours after online publication and is updated daily on week days.
Initial download of the metrics may take a while.