Fig. 1
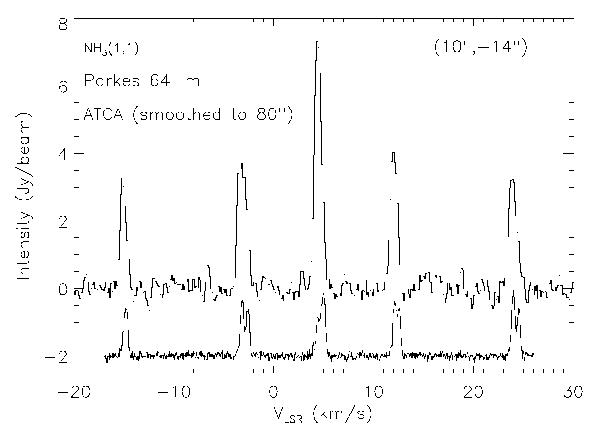
NH3(1,1) inversion line spectrum towards the ammonia maximum as observed with the Parkes 64 m telescope (upper spectrum), at the offset (+ 10″, − 14″) from Cha-MMS1a (Reipurth et al. 1996). The corresponding ATCA spectrum “smoothed” to an 80″ resolution is shown at the bottom. The latter is produced by applying a Gaussian taper to the visibility data.
Current usage metrics show cumulative count of Article Views (full-text article views including HTML views, PDF and ePub downloads, according to the available data) and Abstracts Views on Vision4Press platform.
Data correspond to usage on the plateform after 2015. The current usage metrics is available 48-96 hours after online publication and is updated daily on week days.
Initial download of the metrics may take a while.