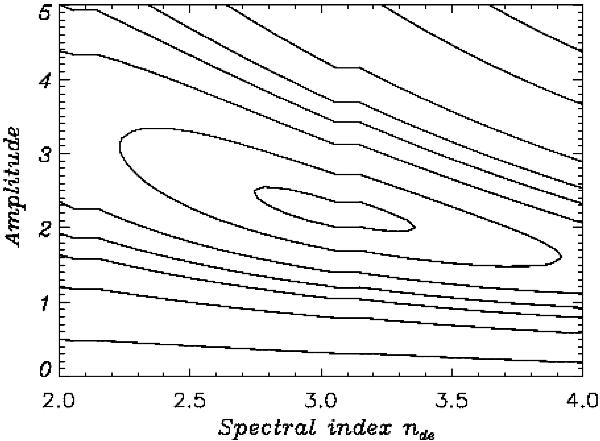
Fig. 3

Two-dimensional plot of the raw likelihood (posterior distribution) as a function of dark energy spectral index nde and the transformed amplitude  , using WMAP 7-yr data. The spherical angles have been fixed to their WMAP best fit values at ℓmax = 20 to enable a projection. The posterior mode value is located at nde = 3.1. The (transformed) amplitude found in this plot is higher than the value for the true anisotropic amplitude noted in Table 1 due to a bias introduced by application of the mask and a linear transformation.
Current usage metrics show cumulative count of Article Views (full-text article views including HTML views, PDF and ePub downloads, according to the available data) and Abstracts Views on Vision4Press platform.
Data correspond to usage on the plateform after 2015. The current usage metrics is available 48-96 hours after online publication and is updated daily on week days.
Initial download of the metrics may take a while.


