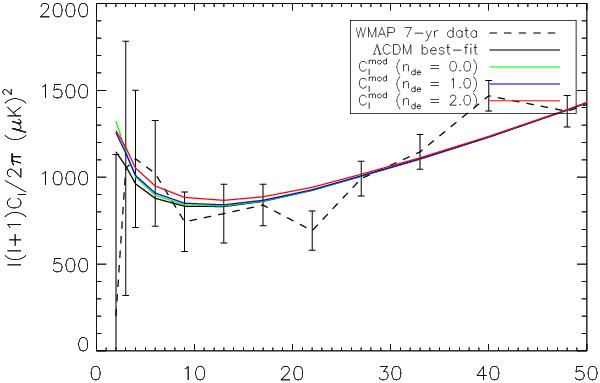
Fig. 2

(Binned) Modified spectra from Eq. (35) plotted as function of dark energy spectral index. Amplitude ϖ0 = 0.9 is used in all instances. Dark energy spectral index values of nde = 0,1,2 are used in this plot. The modified spectra are plotted against the binned WMAP 7-yr data (black stapled line) and the best fit ΛCDM spectrum (black solid line). Error bars indicate 1σ cosmic variance + measurement uncertainty and have been obtained from the diagonal of the Fisher matrix supplied by the WMAP team.
Current usage metrics show cumulative count of Article Views (full-text article views including HTML views, PDF and ePub downloads, according to the available data) and Abstracts Views on Vision4Press platform.
Data correspond to usage on the plateform after 2015. The current usage metrics is available 48-96 hours after online publication and is updated daily on week days.
Initial download of the metrics may take a while.


