| Issue |
A&A
Volume 563, March 2014
|
|
|---|---|---|
| Article Number | L4 | |
| Number of page(s) | 4 | |
| Section | Letters | |
| DOI | https://doi.org/10.1051/0004-6361/201423444 | |
| Published online | 25 February 2014 | |
Convection, granulation, and period jitter in classical Cepheids
Department of Physics & Astronomy, East Tennessee State University, Box 70652, Johnson City, TN 37614 USA
e-mail: This email address is being protected from spambots. You need JavaScript enabled to view it.
Received: 16 January 2014
Accepted: 31 January 2014
Abstract
Analyses of recent observations of the sole classical Cepheid in the Kepler field, V1154 Cygni, found random changes of about 30 min in the pulsation period. These period changes challenge standard theories of pulsation and evolution because the period change is non-secular, and explaining this period jitter is necessary for understanding stellar evolution and the role of Cepheids as precise standard candles. We suggest that convection and convective hot spots can explain the observed period jitter. Convective hot spots alter the timing of flux maximum and minimum in the Cepheid light curve, hence change the measured pulsation period. We present a model of random hot spots that generate a localized flux excess that perturbs the Cepheid light curve and consequently the pulsation period, which is consistent with the observed jitter. This result demonstrates how important understanding convection is for modeling Cepheid stellar structure and evolution, how convection determines the red edge of the instability strip, and just how sensitive Cepheid light curves are to atmospheric physics.
Key words: convection / stars: late-type / starspots / stars: variables: Cepheids / stars: individual: V1154 Cyg
© ESO, 2014
1. Introduction
Classical Cepheids are arguably archetypical standard candles since the discovery of the Cepheid period-luminosity relation or Leavitt law more than a century ago (Leavitt 1908). Because of the brightness of Cepheids, log L/L⊙ = 3−4.5, and the fact that brightness is correlated with the pulsation period, Cepheids are powerful tools for measuring distances to galaxies (e.g. Gerke et al. 2011; Gieren et al. 2013) and even the Hubble constant (Hubble 1929; Freedman et al. 2001, 2012; Riess et al. 2011). An additional strength of Cepheids as standard candles is their consistent and precisely measured pulsation periods.
Cepheid pulsation periods are also observed to change over time. Eddington (1919) presented the first measurements of secular period change in the prototype δ Cephei to confirm previous arguments that period change is a result of a central energy source that is not gravitational contraction. It is now known that the rate of period change is a direct measure of stellar evolution (e.g. Struve 1959) and can test the details of Cepheid evolution, especially Cepheid mass loss (Neilson et al. 2012a,b). The measured changes of pulsation periods presented by Turner et al. (2006) are secular and slowly changing over many years and raise many question such as the nature of the evolution of the nearest Cepheid Polaris (Neilson et al. 2012a; Turner et al. 2013b; van Leeuwen 2013).
New observations are complicating this picture of secular evolution and secular period change. Derekas et al. (2012) presented Kepler observations of V1154 Cygni where they found that the pulsation period varies by about 0.015−0.02 day from its standard pulsation period of about 4.9 days, that is, ΔP/P ≤ 1%. This period jitter is unexpected and presents challenges for detecting binary companions as well as for understanding the physics of Cepheids. Evans et al. (2014) also found similar period jitter from MOST observations of two other Cepheids and that there apparently is more jitter for first-overtone Cepheids. Derekas et al. (2012) made several suggestions to explain this jitter, including an instability in the pulsation period itself, or possibly convective granulation in Cepheids, analogous to convective cells observed in red supergiant stars like Betelgeuse (Gray 2008; Haubois et al. 2009). Convection is known to be important for pulsation in Cepheids, because it defines the red edge of the instability strip (e.g. Yecko et al. 1998; Bono et al. 1999).
Convection is a particularly arduous topic to explore in classical Cepheids and other stars as it is intrinsically a multidimensional problem. Typically, Cepheid structures are computed in one-dimension with various treatments of convection and numerous free parameters (e.g. Buchler & Kolláth 2002; Smolec & Moskalik 2008). New efforts are considering multidimensional simulations of Cepheid structures. Gastine & Dintrans (2011) computed two-dimensional stellar models to explore the interaction between convection and pulsation in a Cepheid. However, their model also assumes free parameters akin to one-dimensional models. Similarly, Geroux & Deupree (2013) presented two-dimensional radiation hydrodynamic models of convection in RR Lyrae stars and found that simulated light curves matched observational light curves. Mundprecht et al. (2013) computed three-dimensional Cepheid models that hint at the presence of granulation. While these models are promising, they are also computationally expensive, requiring both high spacial and temporal resolution, even more so than that required for simulating convection in red supergiant stars (Freytag & Chiavassa 2013).
In this work, we construct a model for convective hot spots that vary as a function of time, number, and size, producing a radiant contribution that is superimposed on a Cepheid light curve. In Sect. 2, we describe the model for convective spots and pulsation. In Sect. 3, we present results for a fundamental-mode model light curve, and results for a first-overtone model light curve in Sect. 4. We summarize our results and discuss implications in Sect. 5.
2. Modeling star spots
We hypothesize that convection can cause period jitter like that observed for V1154 Cyg. The observed period jitter is a random-like shift in the timing of the brightness minimum and maximum. Convective hot spots lead to granulation-like noise that can vary the precise timing of the brightness minimum and maximum. Similarly, convective hot spots have been observed for the red supergiant Betelgeuse (Haubois et al. 2009). Granulation signatures have also been observed in radial velocity data for Kepler target stars, and it has been shown that the radial velocity jitter correlates with stellar fundamental parameters (Bastien et al. 2014).
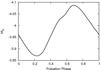 |
Fig. 1 V-band light curve in absolute magnitudes for a 10-day period Cepheid where the light curve is described by the Pejcha & Kochanek (2012) prescription. |
In Fig. 1 we show the light curve prescribed by Pejcha & Kochanek (2012) for a fundamental-mode Cepheid with a 10 d pulsation period. These authors derived the variations of all the relevant physical quantities along a pulsation cycle through a global fit to an extended database of observed pulsation properties for Galactic and Magellanic Cepheids (see Pejcha & Kochanek 2012, for details). If that Cepheid has a period jitter equivalent to that of V1154 Cyg, then the period would vary by about 1.2 h. This corresponds to a phase difference of Δφ = 0.005, and a change of magnitude, ΔMV < 0.001. Therefore, if convective flux variation is about the same order of magnitude, then convective hot spots can explain the period jitter. Furthermore, if the Cepheid is an s-Cepheid or first-overtone Cepheid with a low-amplitude sinusoidal light curve, then similar convective hot spots will cause even stronger period variation because of the more shallow slope of the light curve near flux minimum and maximum. Evans et al. (2014) noted that period variations appear to be consistent for a number of cycles. Therefore, this hypothesis requires that the convective spot lifetime must be about that long as well, especially since a Cepheid’s rotation rate is ≤10 km s-1 (Bersier & Burki 1996).
We constructed a toy model to explore the role of convective hot spots in perturbing the light-curve structures of classical Cepheid stars. This toy model starts by assuming a Cepheid light curve, either a sinusoidal function for first-overtone pulsation or the model provided by Pejcha & Kochanek (2012) for fundamental-mode pulsation. The second step is to then include light fluctuations from convective spots into these light curves at a given phase.
We treated convection and convective spot formation as a random process where at any given time spots randomly form, have a pre-determined lifetime, and fade. There are a random number of hot spots at any given time, based on the assumption there are so many spots over the total number of pulsation cycles considered, with a given temperature that is higher than the stellar effective temperature. It must be noted that spot size, spot number, and spot temperature are degenerate parameters when computing their contributions to the total stellar flux, but our goal here is to devise a simple test to understand whether convective spots can explain the observed period jitter in Cepheids.
To compute models for this work, we considered three parameters for convective spots: the opening angle of a spot, the relative spot temperature, and the probability of a spot forming. We assumed the spot lifetime is about one-tenth of a pulsation period, but it can be much longer without significantly changing the total amount of period jitter, only the correlation of the period shift from one cycle to the next. For instance, if the cell lifetime is much longer than the pulsation period, then the period will appear to decrease for a number of cycles before returning to the original value and likewise increase. For this work, we considered the spot opening-angle to vary from about 4 to 7°, the temperature to be about 3 to 6% of the stellar effective temperature, and 20% probability of there being at least one star spot at any time, where we ignored the role of rotation. The opening angle and temperature variation are arbitrary choices, limited only by the measured convective cell properties of the red supergiant Betelgeuse (Haubois et al. 2009). We consider these values to be intermediate values for stars that are hotter and more compact than Betelgeuse.
3. Results for fundamental-mode pulsation
We computed a series of model light curves for the fundamental-mode Cepheid with a 10-day pulsation period whose light, radius, and temperature variation is prescribed by Pejcha & Kochanek (2012). The corresponding light curve is shown in Fig. 1. We computed ten pulsation cycles where random hot spots were superimposed. The first case is for smaller spots with an opening angle of 4° and a relative temperature of 1.03 × Teff. We computed a second case for a larger angle of 7° and a temperature of 1.06 × Teff. Both cases are shown in Fig. 2.
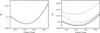 |
Fig. 2 Variation of a Cepheid light curve due to convective hot spots for two cases near flux minimum, where the light curves are folded and the pulsation phase is defined by the initial unperturbed light curve. Left: the case where spots have an opening angle of 4° and Tspot = 1.03 Teff and right where spots have an opening angle of 7° and Tspot = 1.06 Teff. |
The computation of the first case suggests that convective spots cannot be too small or too cool. If the effective temperature at flux minimum is about 5280 K, then the spot temperature is about 5440 K. Moreover, the spot size is small, an opening angle of 4° suggests a relative surface area of <0.5% of the stellar disk, hence this only enhances the luminosity by about 0.003% at the flux minimum, much lower than the scatter of Kepler observations. Many spots would have to be created at the same time to drive period jitter in this case.
The results for the second case, however, are consistent with observed period jitter. The phase where minimum flux occurs varies by Δφ ≈ 0.01 for a 10-day-period Cepheid. This translates into a period jitter of about 2.4 hours, about twice as long as the period jitter extrapolated from V1154 Cyg. Therefore, the observed period jitter can be explained by convective cells, but are these convective spot properties possible?
Haubois et al. (2009) presented interferometric measurements of the red supergiant Betelgeuse and found evidence for large convective spots with an opening angle that is about 1/4 of the stellar diameter and a temperature that is about 1.14 × Teff. These values are much higher than those necessary to explain Cepheid period jitter. Numerical simulations of red supergiants also have similar convective cell properties as those observed (Chiavassa et al. 2010). Hence, we have shown that convective granulation in Cepheids explains the period jitter detected by Derekas et al. (2012).
4. Results for first-overtone pulsation
We repeated our calculations for first-overtone Cepheids or s-Cepheids. These stars typically have more sinusoidal-like light curves, for instance, Polaris and FF Aql (Neilson et al. 2012a; Turner et al. 2013a,b). Because of the shape of the light curve, determining the time of light minimum is more difficult than for a fundamental-mode Cepheid (Poleski 2008). A typical sinusoidal light curve is shown in Fig. 3 with a mean bolometric luminosity, log L/L⊙ = 3 and Teff = 6200 K, similar to FF Aql, but less luminous.
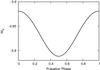 |
Fig. 3 V-band light curve for a small amplitude Cepheid where the light curve is sinusoidal. |
The same spot parameters as those chosen in the previous section were assumed here, and the resulting light-curve variations are shown in Fig. 4. The results for a first-overtone Cepheid are similar to the results for the fundamental-mode Cepheid for the case where star spots have a small opening angle and low temperature excesses. However, the case for which the starspots are larger and hotter, the resulting period jitter and flux variation differs. The flux variation for the first-overtone Cepheid is about ΔMV ≈ 0.001 mag, whereas for the fundamental-mode Cepheid it is ΔMV ≈ 0.002 mag. There is more period jitter for the first-overtone Cepheid with Δφ ≈ 0.02, about twice as much as for the fundamental-mode Cepheid. However, it should be noted that our model for the first-overtone Cepheid assumed an arbitrary pulsation period.
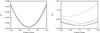 |
Fig. 4 Variation of a first-overtone Cepheid (or s-Cepheid) light curve due to convective hot spots for two cases near flux minimum. Left: the case where spots have an opening angle of 4° and Tspot = 1.03Teff and right where spots have an opening angle of 7° and Tspot = 1.06Teff. |
The amount of period jitter found in our first-overtone Cepheid model is equivalent to a time variation of about 2 h if we assume the pulsation period is that of FF Aql (P = 4.47 days). This period is much shorter than the period of our fundamental-mode Cepheid, but does suggest that low-amplitude sinusoidal pulsation will show more relative period jitter.
5. Discussion
The purpose of this work was to understand whether hot convective cells and convective variations might cause the previously observed period jitter (Derekas et al. 2012). We computed random hot-spot variations given a number of free parameters such as spot size, spot temperature, spot lifetime, and the number of spots. We found flux variations ranging from <0.0001 mag to about 0.002 mag and shifts in light minimum up to Δφ = 0.01 for a fundamental-mode Cepheid and 0.02 for a first-overtone Cepheid.
These results are more extreme than that observed. The Kepler space telescope is able to resolve flux variations of 0.0001 mag and a period jitter of about 0.005, lower than the limits we computed. However, our model is simple and assumes many degenerate free parameters. The model also adopts a Cepheid light curve and then superimposes convective spot fluxes. In reality, the Cepheid light curve that was constructed from observations (Pejcha & Kochanek 2012) would contain the average convective flux, so variation due to spots would both increase and decrease the relative flux, hence we are arguably overestimating the flux variation. Similarly, small changes in our free parameters, such as increasing the number of spots, including limb-darkening and even rotation (albeit slow) could also play a role.
The hypothesis that period jitter is caused by convective hot spots implies that period jitter is itself a function of pulsation period. We computed the period jitter for a 10-day-period Cepheid, but the period was assumed only for the purpose of constructing the initial light curve. In principle, the amount of relative period jitter depends primarily on the size and temperature of the hot spots. Convection is a function of effective temperature and becomes stronger at cooler effective temperatures. This suggests that hotter Cepheids would have smaller hot spots and a weaker relative temperature increase (i.e., Tspot/Teff) than cooler Cepheids. Because there is a linear relation between the effective temperature and pulsation period, as suggested by the Cepheid period-color relation (e.g. Tammann et al. 2003), there will be more relative jitter at longer periods. This suggests that long-period Cepheids, such as l Car and RS Pup, will have more relative period jitter than short-period Cepheids such as δ Cep and V1154 Cyg. Furthermore, this period jitter may complicate distance estimates from ultra-long-period Cepheids (P > 80 days) (Bird et al. 2009; Fiorentino et al. 2012).
On the other hand, it may be possible to use the observed period jitter to constrain fundamental stellar parameters similar to the method suggested by Bastien et al. (2014). As convection and convective instability is a function of effective temperature and gravity, then so must be the relative amount of jitter. One can then combine the amount of period jitter with the average period to help calibrate the Cepheid period-luminosity relation, and fundamental properties for constraining stellar evolution models and multidimensional simulations.
Convective hot spots in Cepheids can be observed by various methods such as interferometric and polarization measurements. More robust interferometric measurements of the third and fourth lobes of the visibility curve of a Cepheid would constrain perturbations in the intensity profile due to star spots, analogous to the observations by Haubois et al. (2009). Similarly, linear polarization measurements will constrain asymmetric structures on the stellar surface (Schwarz & Clarke 1984; Clarke & Schwarz 1984). The combination of the two observations will help constrain the presence and evolution of convective cells and confirm the toy model presented in this work.
While our model is simple, the results are robust enough to conclude that convection and convective cells explain the observed period jitter. However, detailed tests require three-dimensional radiation hydrodynamic simulations of Cepheid atmospheres and the interaction between pulsation and convection. Fokin et al. (1996) computed one-dimensional RHD models for δ Cep and found that numerous shocks propagated throughout the photosphere, reaching velocities of up to three times the sound speed, hence adding another challenge to computing multidimensional models. Even with these challenges, new three-dimensional models of Cepheids are being computed, and this new field is still in its infancy (Mundprecht et al. 2013). In the future, it will be possible to compute grids of pulsating Cepheid atmospheres and potentially verify this work.
Acknowledgments
This work has been supported by a research grant from the NSF (AST-0807664). The authors would also like to thank Nancy Evans for conversations that have helped this work.
References
- Bastien, F. A., Stassun, K. G., Pepper, J., et al. 2014, AJ, 147, 29 [NASA ADS] [CrossRef] [Google Scholar]
- Bersier, D., & Burki, G. 1996, A&A, 306, 417 [Google Scholar]
- Bird, J. C., Stanek, K. Z., & Prieto, J. L. 2009, ApJ, 695, 874 [NASA ADS] [CrossRef] [Google Scholar]
- Bono, G., Marconi, M., & Stellingwerf, R. F. 1999, ApJS, 122, 167 [NASA ADS] [CrossRef] [Google Scholar]
- Buchler, J. R., & Kolláth, Z. 2002, ApJ, 573, 324 [NASA ADS] [CrossRef] [Google Scholar]
- Chiavassa, A., Haubois, X., Young, J. S., et al. 2010, A&A, 515, A12 [NASA ADS] [CrossRef] [EDP Sciences] [Google Scholar]
- Clarke, D., & Schwarz, H. E. 1984, A&A, 132, 375 [NASA ADS] [Google Scholar]
- Derekas, A., Szabó, G. M., Berdnikov, L., et al. 2012, MNRAS, 425, 1312 [NASA ADS] [CrossRef] [Google Scholar]
- Eddington, A. S. 1919, The Observatory, 42, 338 [NASA ADS] [Google Scholar]
- Evans, N. R., Szabó, R., Szabados, L., et al. 2014, in IAU Symp. 301, eds. J. A. Guzik, W. J. Chaplin, G. Handler, & A. Pigulski [arXiv:1401:5032] [Google Scholar]
- Fiorentino, G., Clementini, G., Marconi, M., et al. 2012, Ap&SS, 341, 143 [NASA ADS] [CrossRef] [Google Scholar]
- Fokin, A. B., Gillet, D., & Breitfellner, M. G. 1996, A&A, 307, 503 [NASA ADS] [Google Scholar]
- Freedman, W. L., Madore, B. F., Gibson, B. K., et al. 2001, ApJ, 553, 47 [NASA ADS] [CrossRef] [Google Scholar]
- Freedman, W. L., Madore, B. F., Scowcroft, V., et al. 2012, ApJ, 758, 24 [NASA ADS] [CrossRef] [Google Scholar]
- Freytag, B., & Chiavassa, A. 2013, in EAS Pub. Ser. 60, eds. P. Kervella, T. Le Bertre, & G. Perrin, 137 [Google Scholar]
- Gastine, T., & Dintrans, B. 2011, A&A, 530, L7 [NASA ADS] [CrossRef] [EDP Sciences] [Google Scholar]
- Gerke, J. R., Kochanek, C. S., Prieto, J. L., Stanek, K. Z., & Macri, L. M. 2011, ApJ, 743, 176 [NASA ADS] [CrossRef] [Google Scholar]
- Geroux, C. M., & Deupree, R. G. 2013, ApJ, 771, 113 [NASA ADS] [CrossRef] [Google Scholar]
- Gieren, W., Górski, M., Pietrzyński, G., et al. 2013, ApJ, 773, 69 [NASA ADS] [CrossRef] [Google Scholar]
- Gray, D. F. 2008, AJ, 135, 1450 [Google Scholar]
- Haubois, X., Perrin, G., Lacour, S., et al. 2009, A&A, 508, 923 [NASA ADS] [CrossRef] [EDP Sciences] [Google Scholar]
- Hubble, E. 1929, PNAS, 15, 168 [Google Scholar]
- Leavitt, H. S. 1908, Annals of Harvard College Observatory, 60, 87 [Google Scholar]
- Mundprecht, E., Muthsam, H. J., & Kupka, F. 2013, MNRAS, 435, 3191 [NASA ADS] [CrossRef] [Google Scholar]
- Neilson, H. R., Engle, S. G., Guinan, E., et al. 2012a, ApJ, 745, L32 [NASA ADS] [CrossRef] [Google Scholar]
- Neilson, H. R., Langer, N., Engle, S. G., Guinan, E., & Izzard, R. 2012b, ApJ, 760, L18 [NASA ADS] [CrossRef] [Google Scholar]
- Pejcha, O., & Kochanek, C. S. 2012, ApJ, 748, 107 [NASA ADS] [CrossRef] [Google Scholar]
- Poleski, R. 2008, Acta Astron., 58, 313 [NASA ADS] [Google Scholar]
- Riess, A. G., Macri, L., Casertano, S., et al. 2011, ApJ, 730, 119 [NASA ADS] [CrossRef] [Google Scholar]
- Schwarz, H. E., & Clarke, D. 1984, A&A, 132, 370 [NASA ADS] [Google Scholar]
- Smolec, R., & Moskalik, P. 2008, Acta Astron., 58, 193 [NASA ADS] [Google Scholar]
- Struve, O. 1959, Sky Telesc., 18, 309 [NASA ADS] [Google Scholar]
- Tammann, G. A., Sandage, A., & Reindl, B. 2003, A&A, 404, 423 [NASA ADS] [CrossRef] [EDP Sciences] [Google Scholar]
- Turner, D. G., Abdel-Sabour Abdel-Latif, M., & Berdnikov, L. N. 2006, PASP, 118, 410 [NASA ADS] [CrossRef] [Google Scholar]
- Turner, D. G., Kovtyukh, V. V., Luck, R. E., & Berdnikov, L. N. 2013a, ApJ, 772, L10 [NASA ADS] [CrossRef] [Google Scholar]
- Turner, D. G., Kovtyukh, V. V., Usenko, I. A., & Gorlova, N. I. 2013b, ApJ, 762, L8 [NASA ADS] [CrossRef] [Google Scholar]
- van Leeuwen, F. 2013, A&A, 550, L3 [NASA ADS] [CrossRef] [EDP Sciences] [Google Scholar]
- Yecko, P. A., Kollath, Z., & Buchler, J. R. 1998, A&A, 336, 553 [NASA ADS] [Google Scholar]
All Figures
|
Fig. 1 V-band light curve in absolute magnitudes for a 10-day period Cepheid where the light curve is described by the Pejcha & Kochanek (2012) prescription. |
| In the text | |
|
Fig. 2 Variation of a Cepheid light curve due to convective hot spots for two cases near flux minimum, where the light curves are folded and the pulsation phase is defined by the initial unperturbed light curve. Left: the case where spots have an opening angle of 4° and Tspot = 1.03 Teff and right where spots have an opening angle of 7° and Tspot = 1.06 Teff. |
| In the text | |
|
Fig. 3 V-band light curve for a small amplitude Cepheid where the light curve is sinusoidal. |
| In the text | |
|
Fig. 4 Variation of a first-overtone Cepheid (or s-Cepheid) light curve due to convective hot spots for two cases near flux minimum. Left: the case where spots have an opening angle of 4° and Tspot = 1.03Teff and right where spots have an opening angle of 7° and Tspot = 1.06Teff. |
| In the text | |
Current usage metrics show cumulative count of Article Views (full-text article views including HTML views, PDF and ePub downloads, according to the available data) and Abstracts Views on Vision4Press platform.
Data correspond to usage on the plateform after 2015. The current usage metrics is available 48-96 hours after online publication and is updated daily on week days.
Initial download of the metrics may take a while.