Fig. 2
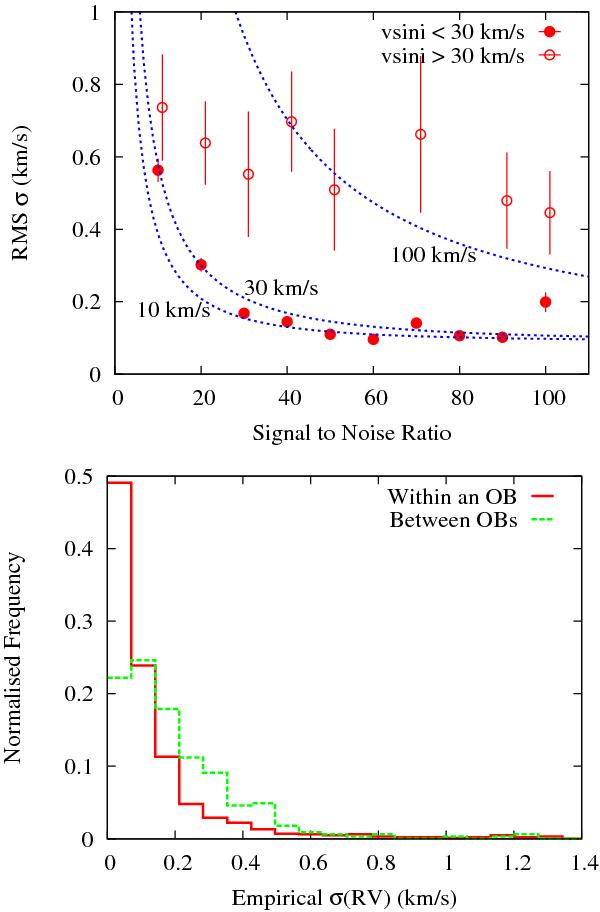
Empirically determined RV precision. Upper panel: rms of the empirically estimated RV uncertainties (see text) from pairs of observations within an OB, binned by S/N. A separate set of points is calculated for stars that have an estimated vsini > 30 km s-1 to demonstrate their larger empirical uncertainties. The lines on the plot are loci determined from Eq. (1) using the coefficients A = 0.09 ± 0.01, B = 3.52 ± 0.23, C = 38 ± 8 for several labelled vsini values. The fit is poorly constrained for large vsini and there are some indications that the semi-empirical model underestimates the uncertainties for such stars at high S/N. Lower panel: frequency distribution of empirical RV uncertainties determined from repeated observations within an OB and from repeated observations from separate OBs. The increase in the width of the latter distribution indicates additional uncertainties associated with wavelength calibration between OBs.
Current usage metrics show cumulative count of Article Views (full-text article views including HTML views, PDF and ePub downloads, according to the available data) and Abstracts Views on Vision4Press platform.
Data correspond to usage on the plateform after 2015. The current usage metrics is available 48-96 hours after online publication and is updated daily on week days.
Initial download of the metrics may take a while.