Fig. 10
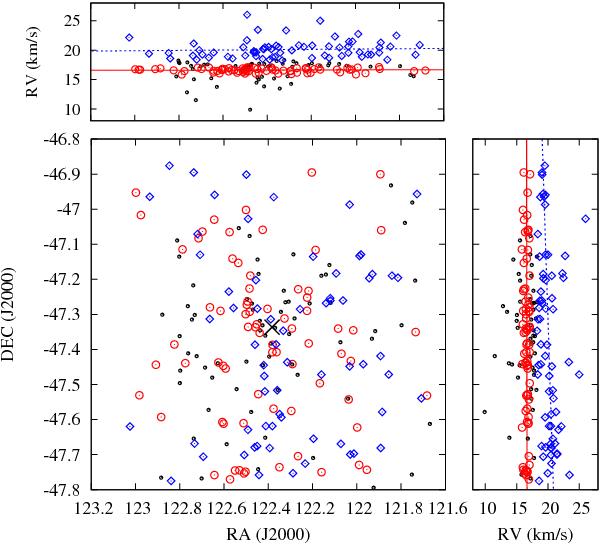
Spatial distribution of populations A and B, defined according to the probability criterion described in Sect. 4.2. In the main panel these populations and the set of cluster members that cannot be confidently assigned to either are shown. Symbols are as defined in Fig. 9. The cross marks the position of γ2 Vel. In the top and side panels we show the distribution of RV with right ascension and declination respectively. The solid (red) lines and the dashed (blue) lines show best-fitting linear relationships for populations A and B respectively.
Current usage metrics show cumulative count of Article Views (full-text article views including HTML views, PDF and ePub downloads, according to the available data) and Abstracts Views on Vision4Press platform.
Data correspond to usage on the plateform after 2015. The current usage metrics is available 48-96 hours after online publication and is updated daily on week days.
Initial download of the metrics may take a while.