Fig. 3
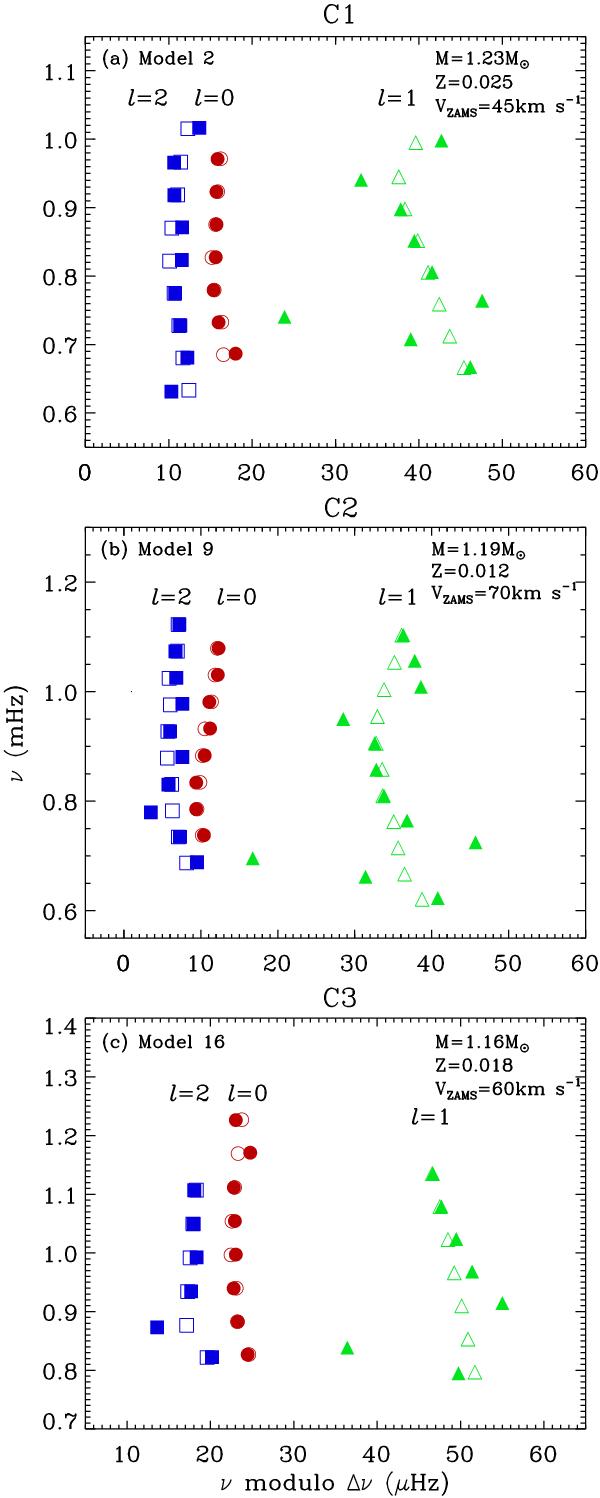
Échelle diagram corresponding to the mean value of ⟨ Δν ⟩ for C1 (Model 2), C2 (Model 9), and C3 (Model 16). The values for modes with ℓ = 0, ℓ = 1, and ℓ = 2 are shown with circles, triangles, and squares, respectively. The average large frequency separation (47.76 μHz for C1, 48.2 μHz for C2, 57.3 μHz for C3) were observed by Mathur et al. (2011) and Campante et al. (2011).
Current usage metrics show cumulative count of Article Views (full-text article views including HTML views, PDF and ePub downloads, according to the available data) and Abstracts Views on Vision4Press platform.
Data correspond to usage on the plateform after 2015. The current usage metrics is available 48-96 hours after online publication and is updated daily on week days.
Initial download of the metrics may take a while.