Fig. 1
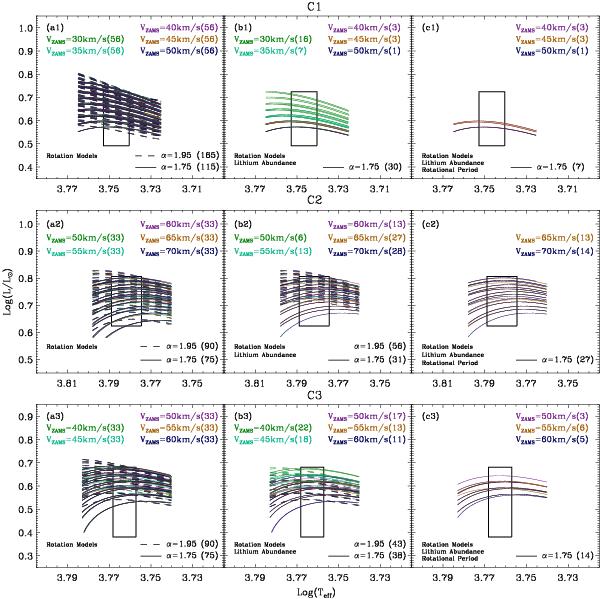
Evolutionary tracks of the stars in the H-R diagram constrained by different observations. The top panel indicates the stellar models of C1, the middle panel those of C2, and the bottom panel those of C3. The observational constraints are effective temperature and luminosity (left panel), added lithium abundance (middle panel), and added rotational rate (right panel) for each star. The solid line presents α = 1.75 and the dashed line presents α = 1.95. The different colors represent rotating models with different initial velocities.
Current usage metrics show cumulative count of Article Views (full-text article views including HTML views, PDF and ePub downloads, according to the available data) and Abstracts Views on Vision4Press platform.
Data correspond to usage on the plateform after 2015. The current usage metrics is available 48-96 hours after online publication and is updated daily on week days.
Initial download of the metrics may take a while.