Fig. 4
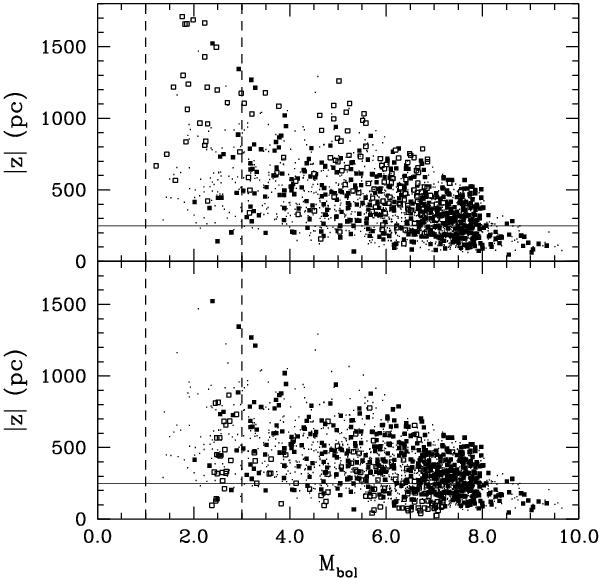
Distribution of distances above the Galactic plane of DA white dwarfs in the sample of Krzesinski et al. (2009) and in our simulated sample as a function of the magnitude. The small symbols correspond to the results of our Monte Carlo simulations, while the large ones represent the observational data. Empty symbols correspond to white dwarfs with derived masses smaller than 0.49 M⊙, whereas filled symbols represent white dwarfs with measured masses larger than this value. The top panel presents the original data of Krzesinski et al. (2009), while the bottom panel shows revised distances obtained assuming that the mass of each of these white dwarfs is 0.49 M⊙.
Current usage metrics show cumulative count of Article Views (full-text article views including HTML views, PDF and ePub downloads, according to the available data) and Abstracts Views on Vision4Press platform.
Data correspond to usage on the plateform after 2015. The current usage metrics is available 48-96 hours after online publication and is updated daily on week days.
Initial download of the metrics may take a while.